Filipino vs Comanche Average Family Size
COMPARE
Filipino
Comanche
Average Family Size
Average Family Size Comparison
Filipinos
Comanche
3.20
AVERAGE FAMILY SIZE
13.6/ 100
METRIC RATING
207th/ 347
METRIC RANK
3.25
AVERAGE FAMILY SIZE
82.8/ 100
METRIC RATING
136th/ 347
METRIC RANK
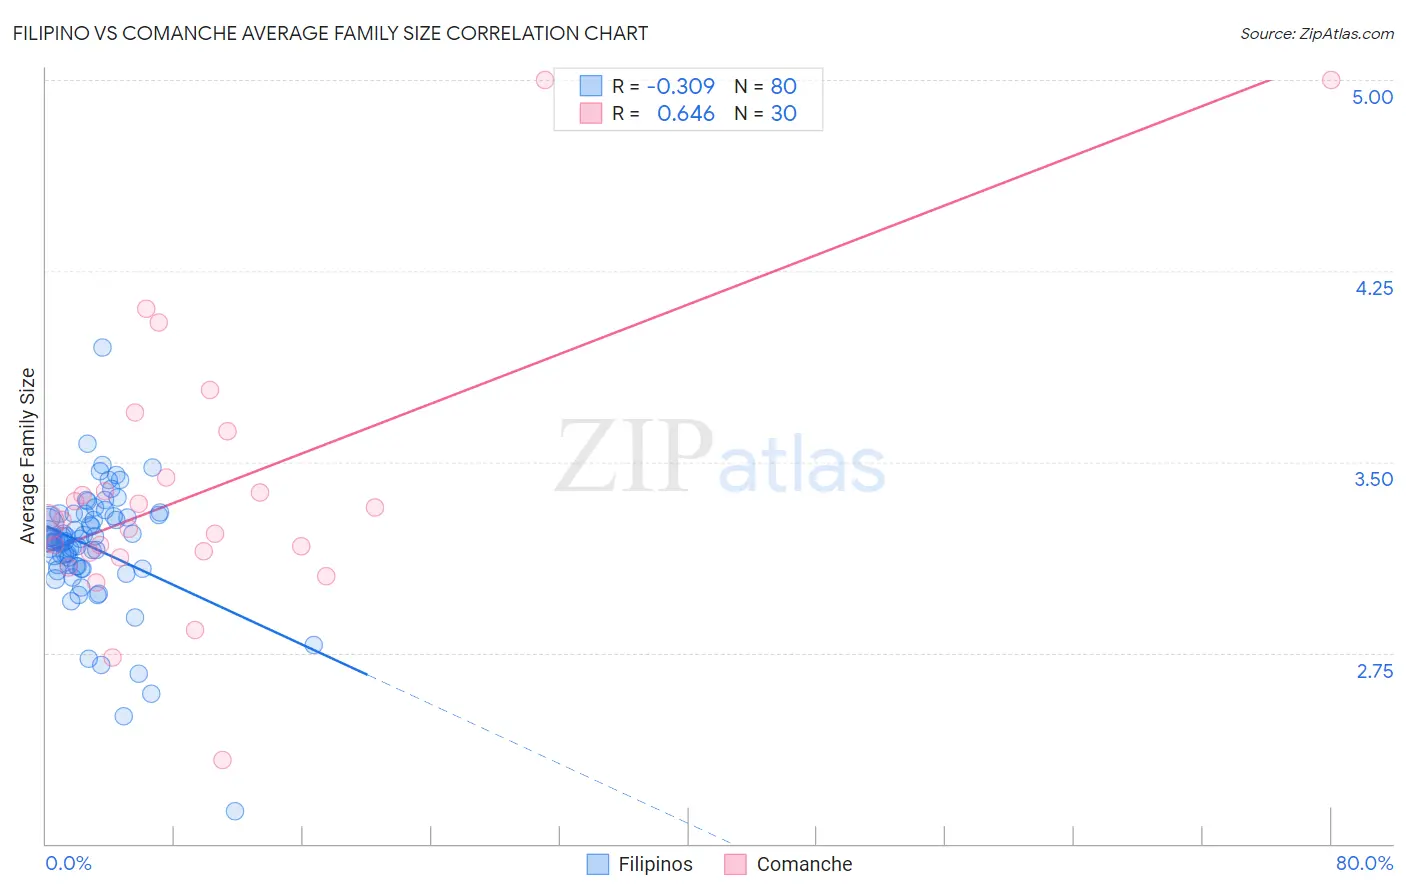
Filipino vs Comanche Average Family Size Correlation Chart
The statistical analysis conducted on geographies consisting of 254,177,261 people shows a mild negative correlation between the proportion of Filipinos and average family size in the United States with a correlation coefficient (R) of -0.309 and weighted average of 3.20. Similarly, the statistical analysis conducted on geographies consisting of 109,768,094 people shows a significant positive correlation between the proportion of Comanche and average family size in the United States with a correlation coefficient (R) of 0.646 and weighted average of 3.25, a difference of 1.6%.
Average Family Size Correlation Summary
| Measurement | Filipino | Comanche |
| Minimum | 2.13 | 2.33 |
| Maximum | 3.95 | 5.00 |
| Range | 1.82 | 2.67 |
| Mean | 3.16 | 3.39 |
| Median | 3.19 | 3.27 |
| Interquartile 25% (IQ1) | 3.09 | 3.14 |
| Interquartile 75% (IQ3) | 3.29 | 3.44 |
| Interquartile Range (IQR) | 0.20 | 0.30 |
| Standard Deviation (Sample) | 0.24 | 0.56 |
| Standard Deviation (Population) | 0.24 | 0.55 |
Similar Demographics by Average Family Size
Demographics Similar to Filipinos by Average Family Size
In terms of average family size, the demographic groups most similar to Filipinos are Chippewa (3.20, a difference of 0.010%), Sudanese (3.20, a difference of 0.010%), Zimbabwean (3.20, a difference of 0.040%), Immigrants from Iran (3.20, a difference of 0.060%), and Creek (3.20, a difference of 0.060%).
| Demographics | Rating | Rank | Average Family Size |
| Immigrants | Kenya | 19.2 /100 | #200 | Poor 3.21 |
| Immigrants | Morocco | 18.5 /100 | #201 | Poor 3.21 |
| Immigrants | India | 18.5 /100 | #202 | Poor 3.21 |
| Immigrants | Nepal | 18.1 /100 | #203 | Poor 3.21 |
| Immigrants | Poland | 16.6 /100 | #204 | Poor 3.20 |
| Paraguayans | 16.3 /100 | #205 | Poor 3.20 |
| Immigrants | Cabo Verde | 16.0 /100 | #206 | Poor 3.20 |
| Filipinos | 13.6 /100 | #207 | Poor 3.20 |
| Chippewa | 13.3 /100 | #208 | Poor 3.20 |
| Sudanese | 13.3 /100 | #209 | Poor 3.20 |
| Zimbabweans | 12.6 /100 | #210 | Poor 3.20 |
| Immigrants | Iran | 12.1 /100 | #211 | Poor 3.20 |
| Creek | 12.1 /100 | #212 | Poor 3.20 |
| Mongolians | 11.5 /100 | #213 | Poor 3.20 |
| Somalis | 11.2 /100 | #214 | Poor 3.20 |
Demographics Similar to Comanche by Average Family Size
In terms of average family size, the demographic groups most similar to Comanche are Immigrants from Middle Africa (3.25, a difference of 0.010%), Cuban (3.25, a difference of 0.030%), Immigrants from Ethiopia (3.25, a difference of 0.040%), Subsaharan African (3.25, a difference of 0.040%), and Venezuelan (3.25, a difference of 0.040%).
| Demographics | Rating | Rank | Average Family Size |
| Immigrants | Hong Kong | 88.6 /100 | #129 | Excellent 3.26 |
| Laotians | 88.5 /100 | #130 | Excellent 3.26 |
| Immigrants | Western Asia | 87.7 /100 | #131 | Excellent 3.26 |
| Costa Ricans | 86.8 /100 | #132 | Excellent 3.26 |
| Immigrants | Venezuela | 86.3 /100 | #133 | Excellent 3.26 |
| Africans | 84.9 /100 | #134 | Excellent 3.25 |
| Panamanians | 84.2 /100 | #135 | Excellent 3.25 |
| Comanche | 82.8 /100 | #136 | Excellent 3.25 |
| Immigrants | Middle Africa | 82.4 /100 | #137 | Excellent 3.25 |
| Cubans | 81.8 /100 | #138 | Excellent 3.25 |
| Immigrants | Ethiopia | 81.6 /100 | #139 | Excellent 3.25 |
| Sub-Saharan Africans | 81.6 /100 | #140 | Excellent 3.25 |
| Venezuelans | 81.4 /100 | #141 | Excellent 3.25 |
| Liberians | 81.2 /100 | #142 | Excellent 3.25 |
| Bhutanese | 81.0 /100 | #143 | Excellent 3.25 |