Immigrants from Singapore vs Comanche Average Family Size
COMPARE
Immigrants from Singapore
Comanche
Average Family Size
Average Family Size Comparison
Immigrants from Singapore
Comanche
3.16
AVERAGE FAMILY SIZE
0.7/ 100
METRIC RATING
269th/ 347
METRIC RANK
3.25
AVERAGE FAMILY SIZE
82.8/ 100
METRIC RATING
136th/ 347
METRIC RANK
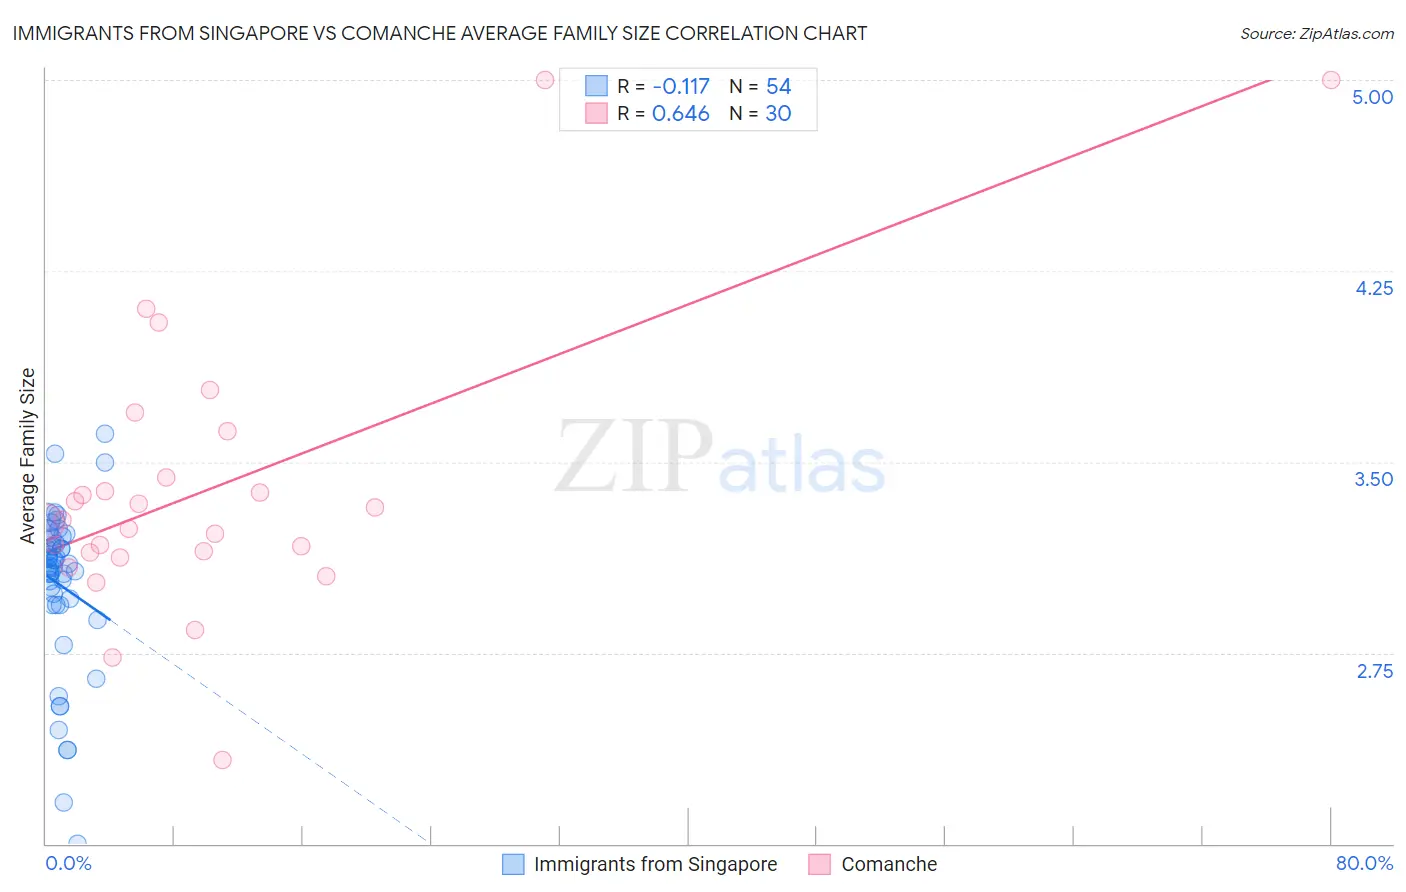
Immigrants from Singapore vs Comanche Average Family Size Correlation Chart
The statistical analysis conducted on geographies consisting of 137,456,280 people shows a poor negative correlation between the proportion of Immigrants from Singapore and average family size in the United States with a correlation coefficient (R) of -0.117 and weighted average of 3.16. Similarly, the statistical analysis conducted on geographies consisting of 109,768,094 people shows a significant positive correlation between the proportion of Comanche and average family size in the United States with a correlation coefficient (R) of 0.646 and weighted average of 3.25, a difference of 3.0%.
Average Family Size Correlation Summary
| Measurement | Immigrants from Singapore | Comanche |
| Minimum | 2.00 | 2.33 |
| Maximum | 3.61 | 5.00 |
| Range | 1.61 | 2.67 |
| Mean | 3.02 | 3.39 |
| Median | 3.09 | 3.27 |
| Interquartile 25% (IQ1) | 2.94 | 3.14 |
| Interquartile 75% (IQ3) | 3.20 | 3.44 |
| Interquartile Range (IQR) | 0.27 | 0.30 |
| Standard Deviation (Sample) | 0.32 | 0.56 |
| Standard Deviation (Population) | 0.32 | 0.55 |
Similar Demographics by Average Family Size
Demographics Similar to Immigrants from Singapore by Average Family Size
In terms of average family size, the demographic groups most similar to Immigrants from Singapore are Maltese (3.16, a difference of 0.010%), Tlingit-Haida (3.16, a difference of 0.030%), Iroquois (3.16, a difference of 0.050%), Immigrants from Germany (3.15, a difference of 0.050%), and Immigrants from Greece (3.16, a difference of 0.070%).
| Demographics | Rating | Rank | Average Family Size |
| Immigrants | Russia | 1.3 /100 | #262 | Tragic 3.16 |
| Immigrants | Bulgaria | 1.0 /100 | #263 | Tragic 3.16 |
| Americans | 1.0 /100 | #264 | Tragic 3.16 |
| Immigrants | South Africa | 0.9 /100 | #265 | Tragic 3.16 |
| Immigrants | Greece | 0.9 /100 | #266 | Tragic 3.16 |
| Iroquois | 0.8 /100 | #267 | Tragic 3.16 |
| Maltese | 0.8 /100 | #268 | Tragic 3.16 |
| Immigrants | Singapore | 0.7 /100 | #269 | Tragic 3.16 |
| Tlingit-Haida | 0.7 /100 | #270 | Tragic 3.16 |
| Immigrants | Germany | 0.7 /100 | #271 | Tragic 3.15 |
| Immigrants | Lithuania | 0.6 /100 | #272 | Tragic 3.15 |
| New Zealanders | 0.6 /100 | #273 | Tragic 3.15 |
| Immigrants | Belgium | 0.6 /100 | #274 | Tragic 3.15 |
| Cambodians | 0.6 /100 | #275 | Tragic 3.15 |
| Immigrants | Bosnia and Herzegovina | 0.5 /100 | #276 | Tragic 3.15 |
Demographics Similar to Comanche by Average Family Size
In terms of average family size, the demographic groups most similar to Comanche are Immigrants from Middle Africa (3.25, a difference of 0.010%), Cuban (3.25, a difference of 0.030%), Immigrants from Ethiopia (3.25, a difference of 0.040%), Subsaharan African (3.25, a difference of 0.040%), and Venezuelan (3.25, a difference of 0.040%).
| Demographics | Rating | Rank | Average Family Size |
| Immigrants | Hong Kong | 88.6 /100 | #129 | Excellent 3.26 |
| Laotians | 88.5 /100 | #130 | Excellent 3.26 |
| Immigrants | Western Asia | 87.7 /100 | #131 | Excellent 3.26 |
| Costa Ricans | 86.8 /100 | #132 | Excellent 3.26 |
| Immigrants | Venezuela | 86.3 /100 | #133 | Excellent 3.26 |
| Africans | 84.9 /100 | #134 | Excellent 3.25 |
| Panamanians | 84.2 /100 | #135 | Excellent 3.25 |
| Comanche | 82.8 /100 | #136 | Excellent 3.25 |
| Immigrants | Middle Africa | 82.4 /100 | #137 | Excellent 3.25 |
| Cubans | 81.8 /100 | #138 | Excellent 3.25 |
| Immigrants | Ethiopia | 81.6 /100 | #139 | Excellent 3.25 |
| Sub-Saharan Africans | 81.6 /100 | #140 | Excellent 3.25 |
| Venezuelans | 81.4 /100 | #141 | Excellent 3.25 |
| Liberians | 81.2 /100 | #142 | Excellent 3.25 |
| Bhutanese | 81.0 /100 | #143 | Excellent 3.25 |