Immigrants from Taiwan vs Colville Married-couple Households
COMPARE
Immigrants from Taiwan
Colville
Married-couple Households
Married-couple Households Comparison
Immigrants from Taiwan
Colville
52.4%
MARRIED-COUPLE HOUSEHOLDS
100.0/ 100
METRIC RATING
2nd/ 347
METRIC RANK
41.0%
MARRIED-COUPLE HOUSEHOLDS
0.0/ 100
METRIC RATING
311th/ 347
METRIC RANK
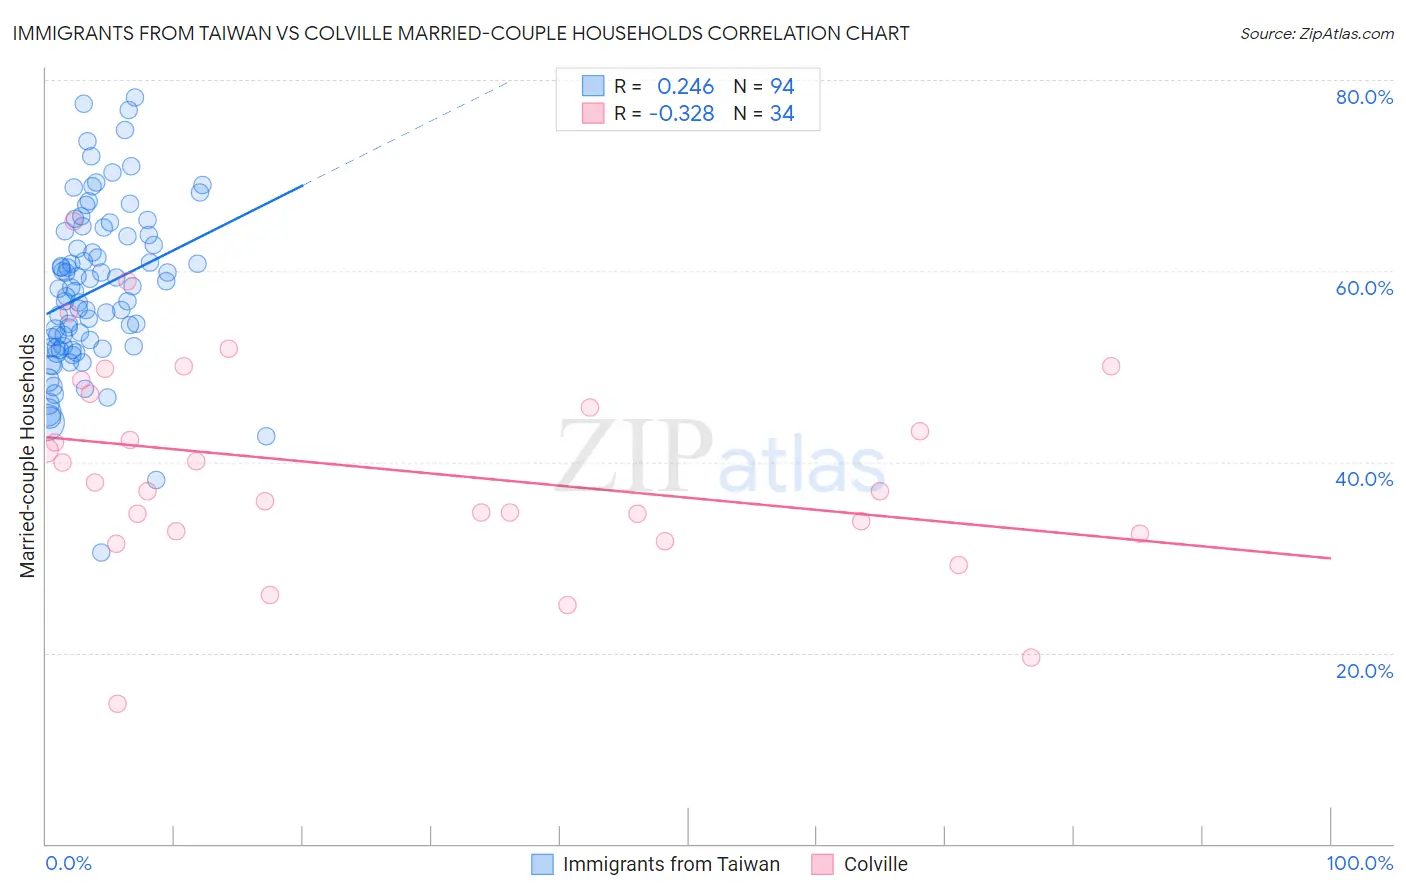
Immigrants from Taiwan vs Colville Married-couple Households Correlation Chart
The statistical analysis conducted on geographies consisting of 298,148,456 people shows a weak positive correlation between the proportion of Immigrants from Taiwan and percentage of married-couple family households in the United States with a correlation coefficient (R) of 0.246 and weighted average of 52.4%. Similarly, the statistical analysis conducted on geographies consisting of 34,682,856 people shows a mild negative correlation between the proportion of Colville and percentage of married-couple family households in the United States with a correlation coefficient (R) of -0.328 and weighted average of 41.0%, a difference of 27.9%.
Married-couple Households Correlation Summary
| Measurement | Immigrants from Taiwan | Colville |
| Minimum | 30.6% | 14.7% |
| Maximum | 78.2% | 65.2% |
| Range | 47.6% | 50.6% |
| Mean | 58.0% | 39.2% |
| Median | 58.0% | 37.4% |
| Interquartile 25% (IQ1) | 51.9% | 32.8% |
| Interquartile 75% (IQ3) | 63.8% | 47.2% |
| Interquartile Range (IQR) | 11.8% | 14.4% |
| Standard Deviation (Sample) | 8.7% | 10.8% |
| Standard Deviation (Population) | 8.6% | 10.7% |
Similar Demographics by Married-couple Households
Demographics Similar to Immigrants from Taiwan by Married-couple Households
In terms of married-couple households, the demographic groups most similar to Immigrants from Taiwan are Immigrants from India (52.7%, a difference of 0.61%), Thai (51.9%, a difference of 0.97%), Assyrian/Chaldean/Syriac (51.8%, a difference of 1.2%), Tongan (51.6%, a difference of 1.7%), and Danish (51.1%, a difference of 2.6%).
| Demographics | Rating | Rank | Married-couple Households |
| Immigrants | India | 100.0 /100 | #1 | Exceptional 52.7% |
| Immigrants | Taiwan | 100.0 /100 | #2 | Exceptional 52.4% |
| Thais | 100.0 /100 | #3 | Exceptional 51.9% |
| Assyrians/Chaldeans/Syriacs | 100.0 /100 | #4 | Exceptional 51.8% |
| Tongans | 100.0 /100 | #5 | Exceptional 51.6% |
| Danes | 100.0 /100 | #6 | Exceptional 51.1% |
| Filipinos | 100.0 /100 | #7 | Exceptional 51.0% |
| Immigrants | South Central Asia | 100.0 /100 | #8 | Exceptional 50.6% |
| Pennsylvania Germans | 100.0 /100 | #9 | Exceptional 50.4% |
| Chinese | 100.0 /100 | #10 | Exceptional 50.4% |
| Immigrants | Pakistan | 100.0 /100 | #11 | Exceptional 50.1% |
| Swiss | 100.0 /100 | #12 | Exceptional 49.9% |
| Immigrants | Korea | 100.0 /100 | #13 | Exceptional 49.9% |
| Burmese | 100.0 /100 | #14 | Exceptional 49.8% |
| Koreans | 99.9 /100 | #15 | Exceptional 49.7% |
Demographics Similar to Colville by Married-couple Households
In terms of married-couple households, the demographic groups most similar to Colville are African (40.9%, a difference of 0.090%), Immigrants from Haiti (40.9%, a difference of 0.15%), Jamaican (40.9%, a difference of 0.22%), Trinidadian and Tobagonian (40.9%, a difference of 0.30%), and Immigrants from Caribbean (40.8%, a difference of 0.49%).
| Demographics | Rating | Rank | Married-couple Households |
| Immigrants | Guyana | 0.0 /100 | #304 | Tragic 41.6% |
| Sioux | 0.0 /100 | #305 | Tragic 41.5% |
| Guyanese | 0.0 /100 | #306 | Tragic 41.4% |
| Immigrants | Western Africa | 0.0 /100 | #307 | Tragic 41.4% |
| Crow | 0.0 /100 | #308 | Tragic 41.4% |
| Immigrants | Trinidad and Tobago | 0.0 /100 | #309 | Tragic 41.2% |
| Haitians | 0.0 /100 | #310 | Tragic 41.2% |
| Colville | 0.0 /100 | #311 | Tragic 41.0% |
| Africans | 0.0 /100 | #312 | Tragic 40.9% |
| Immigrants | Haiti | 0.0 /100 | #313 | Tragic 40.9% |
| Jamaicans | 0.0 /100 | #314 | Tragic 40.9% |
| Trinidadians and Tobagonians | 0.0 /100 | #315 | Tragic 40.9% |
| Immigrants | Caribbean | 0.0 /100 | #316 | Tragic 40.8% |
| Immigrants | Jamaica | 0.0 /100 | #317 | Tragic 40.7% |
| Liberians | 0.0 /100 | #318 | Tragic 40.7% |