Immigrants from Taiwan vs Portuguese Single Mother Households
COMPARE
Immigrants from Taiwan
Portuguese
Single Mother Households
Single Mother Households Comparison
Immigrants from Taiwan
Portuguese
4.7%
SINGLE MOTHER HOUSEHOLDS
100.0/ 100
METRIC RATING
1st/ 347
METRIC RANK
6.4%
SINGLE MOTHER HOUSEHOLDS
40.0/ 100
METRIC RATING
178th/ 347
METRIC RANK
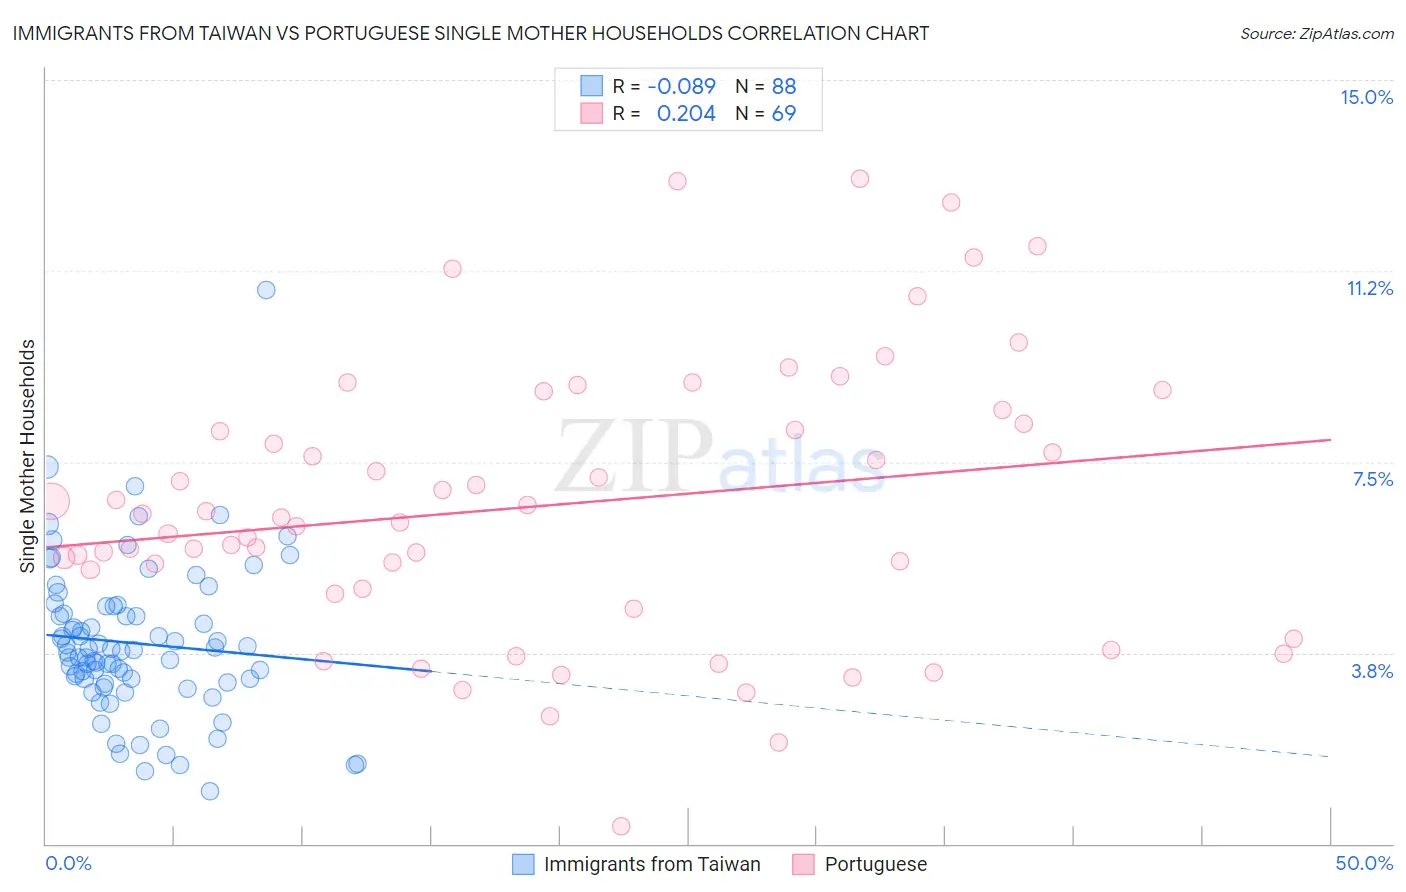
Immigrants from Taiwan vs Portuguese Single Mother Households Correlation Chart
The statistical analysis conducted on geographies consisting of 297,635,593 people shows a slight negative correlation between the proportion of Immigrants from Taiwan and percentage of single mother households in the United States with a correlation coefficient (R) of -0.089 and weighted average of 4.7%. Similarly, the statistical analysis conducted on geographies consisting of 448,231,637 people shows a weak positive correlation between the proportion of Portuguese and percentage of single mother households in the United States with a correlation coefficient (R) of 0.204 and weighted average of 6.4%, a difference of 36.3%.
Single Mother Households Correlation Summary
| Measurement | Immigrants from Taiwan | Portuguese |
| Minimum | 1.0% | 0.35% |
| Maximum | 10.9% | 13.1% |
| Range | 9.8% | 12.7% |
| Mean | 3.9% | 6.7% |
| Median | 3.8% | 6.4% |
| Interquartile 25% (IQ1) | 3.2% | 5.0% |
| Interquartile 75% (IQ3) | 4.6% | 8.4% |
| Interquartile Range (IQR) | 1.4% | 3.4% |
| Standard Deviation (Sample) | 1.5% | 2.7% |
| Standard Deviation (Population) | 1.5% | 2.7% |
Similar Demographics by Single Mother Households
Demographics Similar to Immigrants from Taiwan by Single Mother Households
In terms of single mother households, the demographic groups most similar to Immigrants from Taiwan are Filipino (4.7%, a difference of 0.30%), Immigrants from Iran (4.8%, a difference of 2.6%), Assyrian/Chaldean/Syriac (4.8%, a difference of 2.7%), Immigrants from Hong Kong (4.8%, a difference of 3.3%), and Immigrants from Singapore (5.0%, a difference of 5.9%).
| Demographics | Rating | Rank | Single Mother Households |
| Immigrants | Taiwan | 100.0 /100 | #1 | Exceptional 4.7% |
| Filipinos | 100.0 /100 | #2 | Exceptional 4.7% |
| Immigrants | Iran | 100.0 /100 | #3 | Exceptional 4.8% |
| Assyrians/Chaldeans/Syriacs | 100.0 /100 | #4 | Exceptional 4.8% |
| Immigrants | Hong Kong | 100.0 /100 | #5 | Exceptional 4.8% |
| Immigrants | Singapore | 100.0 /100 | #6 | Exceptional 5.0% |
| Iranians | 100.0 /100 | #7 | Exceptional 5.0% |
| Immigrants | Ireland | 99.9 /100 | #8 | Exceptional 5.0% |
| Okinawans | 99.9 /100 | #9 | Exceptional 5.0% |
| Immigrants | Israel | 99.9 /100 | #10 | Exceptional 5.0% |
| Immigrants | China | 99.9 /100 | #11 | Exceptional 5.1% |
| Cypriots | 99.9 /100 | #12 | Exceptional 5.1% |
| Immigrants | India | 99.9 /100 | #13 | Exceptional 5.1% |
| Immigrants | Australia | 99.9 /100 | #14 | Exceptional 5.1% |
| Immigrants | Eastern Asia | 99.9 /100 | #15 | Exceptional 5.1% |
Demographics Similar to Portuguese by Single Mother Households
In terms of single mother households, the demographic groups most similar to Portuguese are Hmong (6.4%, a difference of 0.020%), Osage (6.4%, a difference of 0.34%), Immigrants from Nepal (6.4%, a difference of 0.45%), Immigrants from Bosnia and Herzegovina (6.3%, a difference of 0.49%), and Marshallese (6.3%, a difference of 0.65%).
| Demographics | Rating | Rank | Single Mother Households |
| Afghans | 52.5 /100 | #171 | Average 6.3% |
| Immigrants | South Eastern Asia | 52.2 /100 | #172 | Average 6.3% |
| Immigrants | Vietnam | 51.5 /100 | #173 | Average 6.3% |
| Immigrants | Morocco | 50.0 /100 | #174 | Average 6.3% |
| Marshallese | 45.8 /100 | #175 | Average 6.3% |
| Immigrants | Bosnia and Herzegovina | 44.3 /100 | #176 | Average 6.3% |
| Osage | 43.0 /100 | #177 | Average 6.4% |
| Portuguese | 40.0 /100 | #178 | Fair 6.4% |
| Hmong | 39.8 /100 | #179 | Fair 6.4% |
| Immigrants | Nepal | 36.1 /100 | #180 | Fair 6.4% |
| Spanish | 33.4 /100 | #181 | Fair 6.4% |
| South American Indians | 33.4 /100 | #182 | Fair 6.4% |
| Spaniards | 27.8 /100 | #183 | Fair 6.5% |
| Ethiopians | 26.0 /100 | #184 | Fair 6.5% |
| Ugandans | 25.6 /100 | #185 | Fair 6.5% |