Immigrants from Taiwan vs Scotch-Irish Doctorate Degree
COMPARE
Immigrants from Taiwan
Scotch-Irish
Doctorate Degree
Doctorate Degree Comparison
Immigrants from Taiwan
Scotch-Irish
3.2%
DOCTORATE DEGREE
100.0/ 100
METRIC RATING
4th/ 347
METRIC RANK
1.9%
DOCTORATE DEGREE
63.6/ 100
METRIC RATING
165th/ 347
METRIC RANK
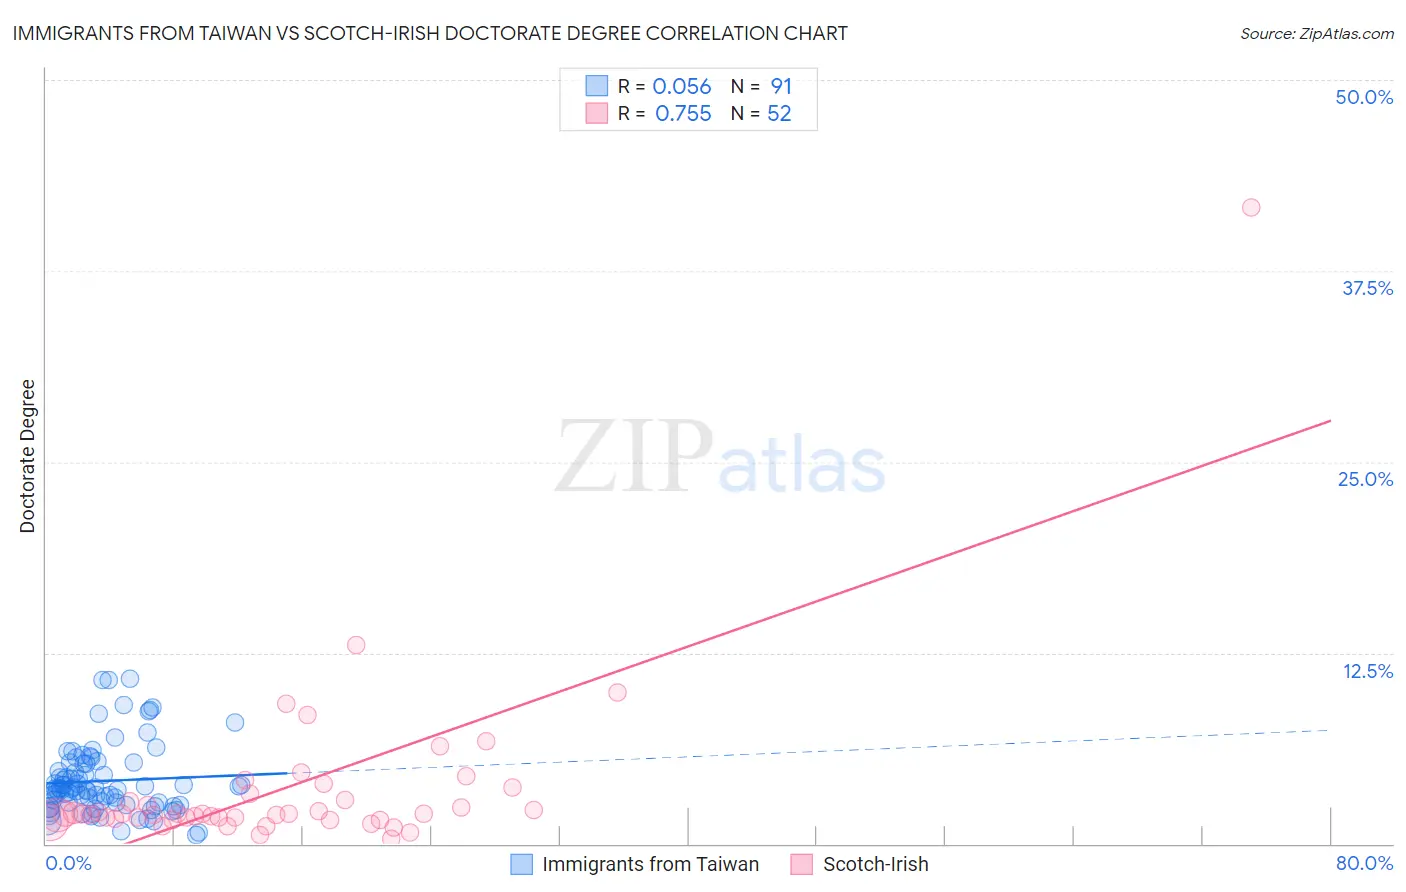
Immigrants from Taiwan vs Scotch-Irish Doctorate Degree Correlation Chart
The statistical analysis conducted on geographies consisting of 297,175,735 people shows a slight positive correlation between the proportion of Immigrants from Taiwan and percentage of population with at least doctorate degree education in the United States with a correlation coefficient (R) of 0.056 and weighted average of 3.2%. Similarly, the statistical analysis conducted on geographies consisting of 527,994,945 people shows a strong positive correlation between the proportion of Scotch-Irish and percentage of population with at least doctorate degree education in the United States with a correlation coefficient (R) of 0.755 and weighted average of 1.9%, a difference of 70.4%.
Doctorate Degree Correlation Summary
| Measurement | Immigrants from Taiwan | Scotch-Irish |
| Minimum | 0.55% | 0.30% |
| Maximum | 10.8% | 41.7% |
| Range | 10.2% | 41.4% |
| Mean | 4.1% | 3.6% |
| Median | 3.6% | 1.9% |
| Interquartile 25% (IQ1) | 2.5% | 1.7% |
| Interquartile 75% (IQ3) | 5.3% | 3.1% |
| Interquartile Range (IQR) | 2.7% | 1.4% |
| Standard Deviation (Sample) | 2.2% | 5.9% |
| Standard Deviation (Population) | 2.2% | 5.9% |
Similar Demographics by Doctorate Degree
Demographics Similar to Immigrants from Taiwan by Doctorate Degree
In terms of doctorate degree, the demographic groups most similar to Immigrants from Taiwan are Iranian (3.1%, a difference of 1.5%), Okinawan (3.3%, a difference of 2.6%), Immigrants from Switzerland (3.1%, a difference of 3.5%), Immigrants from China (3.1%, a difference of 3.6%), and Immigrants from Israel (3.0%, a difference of 4.9%).
| Demographics | Rating | Rank | Doctorate Degree |
| Immigrants | Singapore | 100.0 /100 | #1 | Exceptional 3.7% |
| Filipinos | 100.0 /100 | #2 | Exceptional 3.4% |
| Okinawans | 100.0 /100 | #3 | Exceptional 3.3% |
| Immigrants | Taiwan | 100.0 /100 | #4 | Exceptional 3.2% |
| Iranians | 100.0 /100 | #5 | Exceptional 3.1% |
| Immigrants | Switzerland | 100.0 /100 | #6 | Exceptional 3.1% |
| Immigrants | China | 100.0 /100 | #7 | Exceptional 3.1% |
| Immigrants | Israel | 100.0 /100 | #8 | Exceptional 3.0% |
| Immigrants | Iran | 100.0 /100 | #9 | Exceptional 3.0% |
| Immigrants | Eastern Asia | 100.0 /100 | #10 | Exceptional 3.0% |
| Indians (Asian) | 100.0 /100 | #11 | Exceptional 2.9% |
| Immigrants | Belgium | 100.0 /100 | #12 | Exceptional 2.9% |
| Immigrants | Sweden | 100.0 /100 | #13 | Exceptional 2.9% |
| Immigrants | France | 100.0 /100 | #14 | Exceptional 2.9% |
| Immigrants | India | 100.0 /100 | #15 | Exceptional 2.8% |
Demographics Similar to Scotch-Irish by Doctorate Degree
In terms of doctorate degree, the demographic groups most similar to Scotch-Irish are Spaniard (1.9%, a difference of 0.020%), Macedonian (1.9%, a difference of 0.41%), Celtic (1.9%, a difference of 0.49%), Sri Lankan (1.9%, a difference of 0.51%), and Czech (1.9%, a difference of 0.58%).
| Demographics | Rating | Rank | Doctorate Degree |
| Hungarians | 71.7 /100 | #158 | Good 1.9% |
| Slovenes | 70.2 /100 | #159 | Good 1.9% |
| Welsh | 69.7 /100 | #160 | Good 1.9% |
| Immigrants | Middle Africa | 68.8 /100 | #161 | Good 1.9% |
| Irish | 67.5 /100 | #162 | Good 1.9% |
| Czechs | 67.3 /100 | #163 | Good 1.9% |
| Celtics | 66.7 /100 | #164 | Good 1.9% |
| Scotch-Irish | 63.6 /100 | #165 | Good 1.9% |
| Spaniards | 63.5 /100 | #166 | Good 1.9% |
| Macedonians | 60.9 /100 | #167 | Good 1.9% |
| Sri Lankans | 60.3 /100 | #168 | Good 1.9% |
| Vietnamese | 54.8 /100 | #169 | Average 1.9% |
| Costa Ricans | 53.3 /100 | #170 | Average 1.8% |
| Bermudans | 52.1 /100 | #171 | Average 1.8% |
| Belgians | 50.3 /100 | #172 | Average 1.8% |