Immigrants from Taiwan vs European Single Mother Households
COMPARE
Immigrants from Taiwan
European
Single Mother Households
Single Mother Households Comparison
Immigrants from Taiwan
Europeans
4.7%
SINGLE MOTHER HOUSEHOLDS
100.0/ 100
METRIC RATING
1st/ 347
METRIC RANK
5.7%
SINGLE MOTHER HOUSEHOLDS
97.0/ 100
METRIC RATING
91st/ 347
METRIC RANK
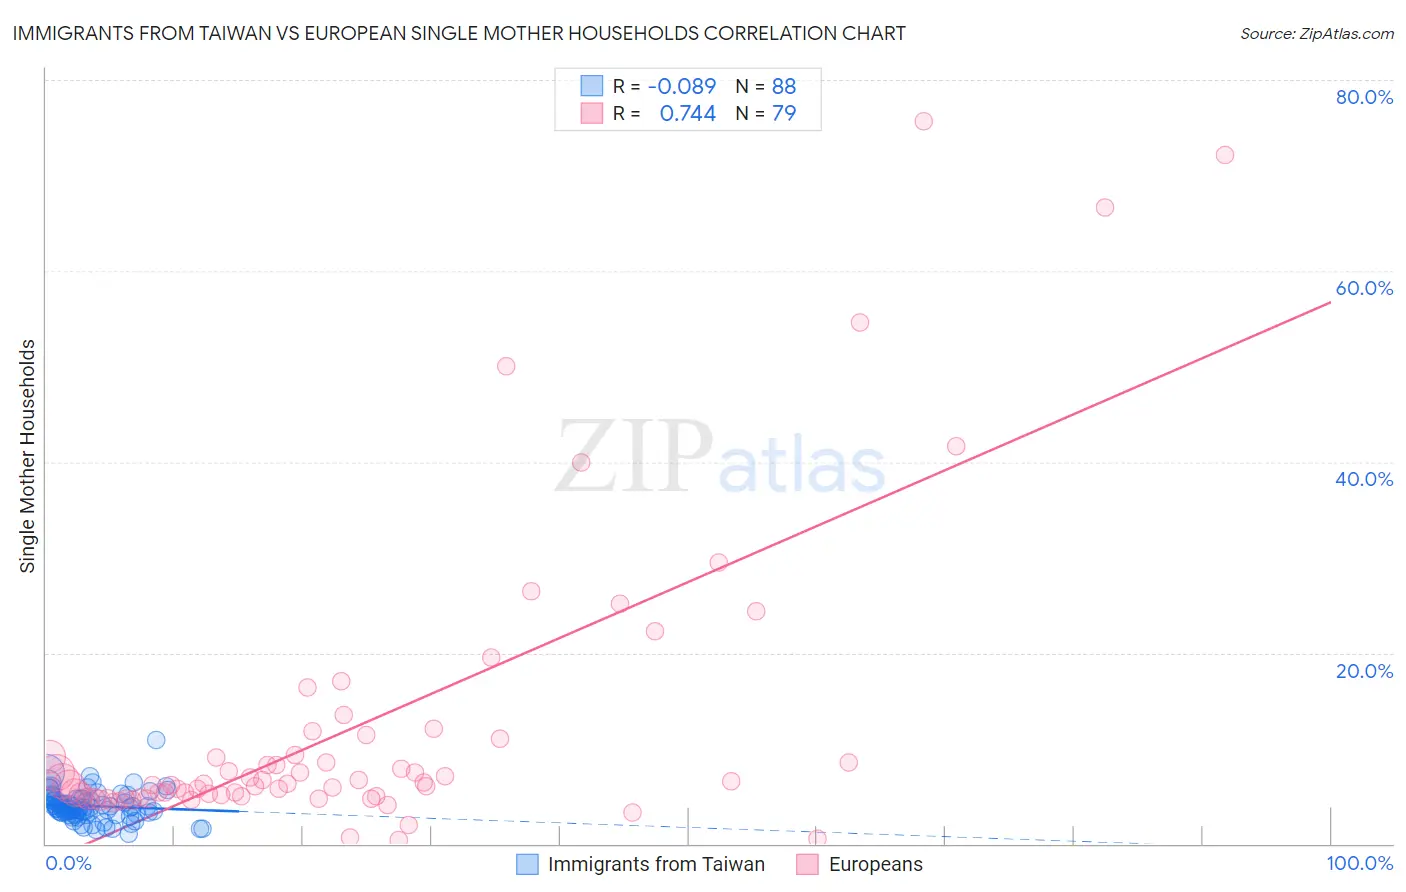
Immigrants from Taiwan vs European Single Mother Households Correlation Chart
The statistical analysis conducted on geographies consisting of 297,635,593 people shows a slight negative correlation between the proportion of Immigrants from Taiwan and percentage of single mother households in the United States with a correlation coefficient (R) of -0.089 and weighted average of 4.7%. Similarly, the statistical analysis conducted on geographies consisting of 557,141,614 people shows a strong positive correlation between the proportion of Europeans and percentage of single mother households in the United States with a correlation coefficient (R) of 0.744 and weighted average of 5.7%, a difference of 22.0%.
Single Mother Households Correlation Summary
| Measurement | Immigrants from Taiwan | European |
| Minimum | 1.0% | 0.36% |
| Maximum | 10.9% | 75.7% |
| Range | 9.8% | 75.3% |
| Mean | 3.9% | 12.4% |
| Median | 3.8% | 6.3% |
| Interquartile 25% (IQ1) | 3.2% | 5.0% |
| Interquartile 75% (IQ3) | 4.6% | 11.1% |
| Interquartile Range (IQR) | 1.4% | 6.1% |
| Standard Deviation (Sample) | 1.5% | 15.7% |
| Standard Deviation (Population) | 1.5% | 15.6% |
Similar Demographics by Single Mother Households
Demographics Similar to Immigrants from Taiwan by Single Mother Households
In terms of single mother households, the demographic groups most similar to Immigrants from Taiwan are Filipino (4.7%, a difference of 0.30%), Immigrants from Iran (4.8%, a difference of 2.6%), Assyrian/Chaldean/Syriac (4.8%, a difference of 2.7%), Immigrants from Hong Kong (4.8%, a difference of 3.3%), and Immigrants from Singapore (5.0%, a difference of 5.9%).
| Demographics | Rating | Rank | Single Mother Households |
| Immigrants | Taiwan | 100.0 /100 | #1 | Exceptional 4.7% |
| Filipinos | 100.0 /100 | #2 | Exceptional 4.7% |
| Immigrants | Iran | 100.0 /100 | #3 | Exceptional 4.8% |
| Assyrians/Chaldeans/Syriacs | 100.0 /100 | #4 | Exceptional 4.8% |
| Immigrants | Hong Kong | 100.0 /100 | #5 | Exceptional 4.8% |
| Immigrants | Singapore | 100.0 /100 | #6 | Exceptional 5.0% |
| Iranians | 100.0 /100 | #7 | Exceptional 5.0% |
| Immigrants | Ireland | 99.9 /100 | #8 | Exceptional 5.0% |
| Okinawans | 99.9 /100 | #9 | Exceptional 5.0% |
| Immigrants | Israel | 99.9 /100 | #10 | Exceptional 5.0% |
| Immigrants | China | 99.9 /100 | #11 | Exceptional 5.1% |
| Cypriots | 99.9 /100 | #12 | Exceptional 5.1% |
| Immigrants | India | 99.9 /100 | #13 | Exceptional 5.1% |
| Immigrants | Australia | 99.9 /100 | #14 | Exceptional 5.1% |
| Immigrants | Eastern Asia | 99.9 /100 | #15 | Exceptional 5.1% |
Demographics Similar to Europeans by Single Mother Households
In terms of single mother households, the demographic groups most similar to Europeans are Immigrants from Indonesia (5.7%, a difference of 0.22%), Immigrants from Western Asia (5.7%, a difference of 0.23%), Serbian (5.7%, a difference of 0.24%), Ukrainian (5.7%, a difference of 0.28%), and Basque (5.7%, a difference of 0.29%).
| Demographics | Rating | Rank | Single Mother Households |
| Carpatho Rusyns | 97.7 /100 | #84 | Exceptional 5.7% |
| Hungarians | 97.6 /100 | #85 | Exceptional 5.7% |
| Finns | 97.6 /100 | #86 | Exceptional 5.7% |
| Immigrants | Turkey | 97.5 /100 | #87 | Exceptional 5.7% |
| Israelis | 97.4 /100 | #88 | Exceptional 5.7% |
| Ukrainians | 97.2 /100 | #89 | Exceptional 5.7% |
| Immigrants | Indonesia | 97.2 /100 | #90 | Exceptional 5.7% |
| Europeans | 97.0 /100 | #91 | Exceptional 5.7% |
| Immigrants | Western Asia | 96.7 /100 | #92 | Exceptional 5.7% |
| Serbians | 96.7 /100 | #93 | Exceptional 5.7% |
| Basques | 96.7 /100 | #94 | Exceptional 5.7% |
| Slovaks | 96.6 /100 | #95 | Exceptional 5.7% |
| Austrians | 96.4 /100 | #96 | Exceptional 5.7% |
| Tlingit-Haida | 96.4 /100 | #97 | Exceptional 5.7% |
| Immigrants | South Africa | 96.3 /100 | #98 | Exceptional 5.7% |