Immigrants from Belgium vs Colville Married-couple Households
COMPARE
Immigrants from Belgium
Colville
Married-couple Households
Married-couple Households Comparison
Immigrants from Belgium
Colville
47.9%
MARRIED-COUPLE HOUSEHOLDS
96.8/ 100
METRIC RATING
95th/ 347
METRIC RANK
41.0%
MARRIED-COUPLE HOUSEHOLDS
0.0/ 100
METRIC RATING
311th/ 347
METRIC RANK
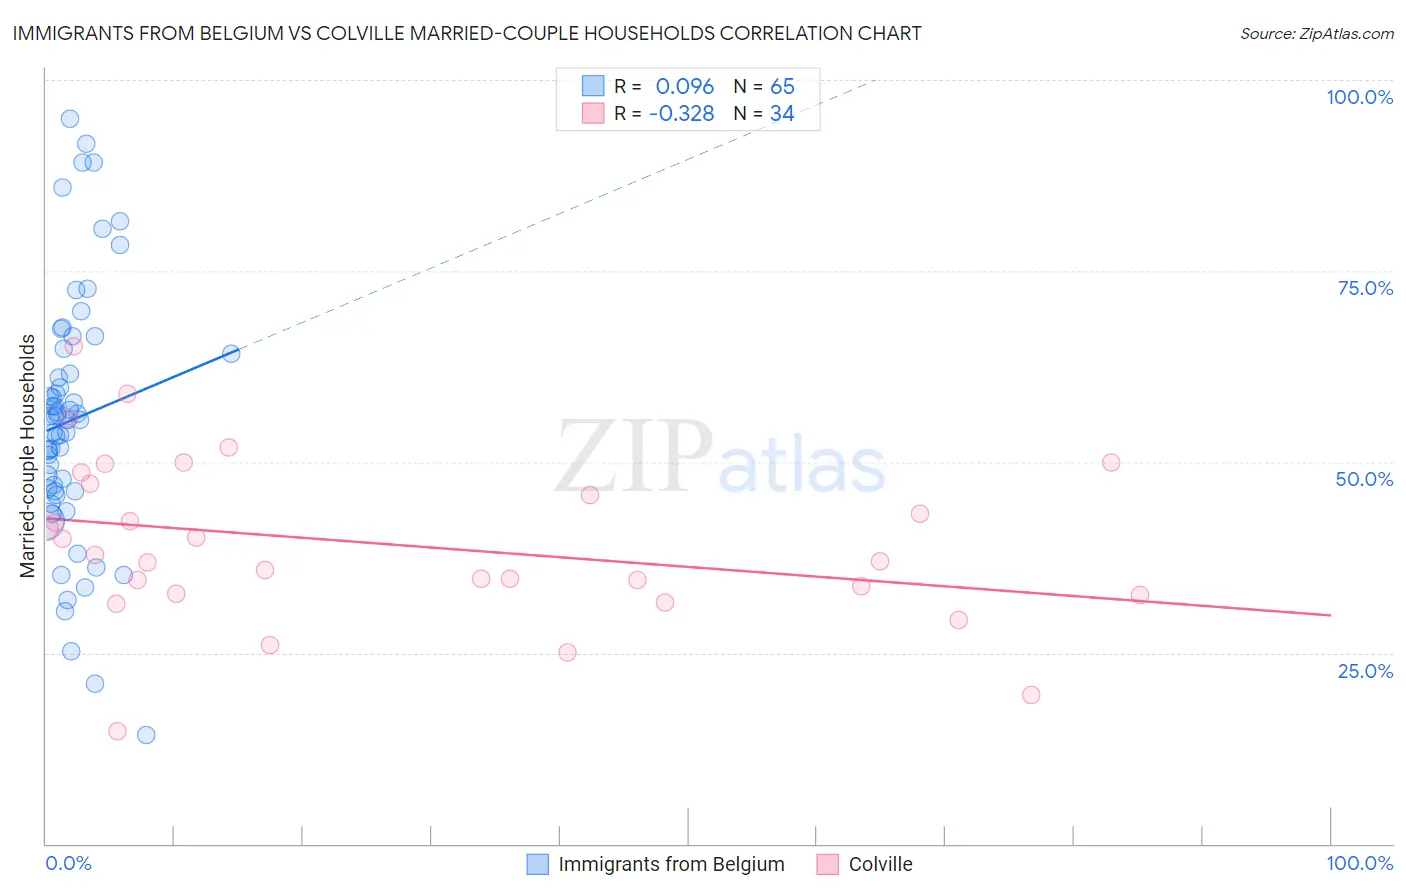
Immigrants from Belgium vs Colville Married-couple Households Correlation Chart
The statistical analysis conducted on geographies consisting of 146,698,570 people shows a slight positive correlation between the proportion of Immigrants from Belgium and percentage of married-couple family households in the United States with a correlation coefficient (R) of 0.096 and weighted average of 47.9%. Similarly, the statistical analysis conducted on geographies consisting of 34,682,856 people shows a mild negative correlation between the proportion of Colville and percentage of married-couple family households in the United States with a correlation coefficient (R) of -0.328 and weighted average of 41.0%, a difference of 17.0%.
Married-couple Households Correlation Summary
| Measurement | Immigrants from Belgium | Colville |
| Minimum | 14.3% | 14.7% |
| Maximum | 94.9% | 65.2% |
| Range | 80.6% | 50.6% |
| Mean | 55.5% | 39.2% |
| Median | 55.5% | 37.4% |
| Interquartile 25% (IQ1) | 46.1% | 32.8% |
| Interquartile 75% (IQ3) | 64.5% | 47.2% |
| Interquartile Range (IQR) | 18.4% | 14.4% |
| Standard Deviation (Sample) | 16.6% | 10.8% |
| Standard Deviation (Population) | 16.5% | 10.7% |
Similar Demographics by Married-couple Households
Demographics Similar to Immigrants from Belgium by Married-couple Households
In terms of married-couple households, the demographic groups most similar to Immigrants from Belgium are American (47.9%, a difference of 0.030%), Lebanese (47.9%, a difference of 0.040%), Immigrants from Egypt (47.9%, a difference of 0.050%), Palestinian (48.0%, a difference of 0.060%), and Immigrants from Moldova (48.0%, a difference of 0.070%).
| Demographics | Rating | Rank | Married-couple Households |
| Afghans | 97.3 /100 | #88 | Exceptional 48.0% |
| Cypriots | 97.2 /100 | #89 | Exceptional 48.0% |
| French | 97.2 /100 | #90 | Exceptional 48.0% |
| Immigrants | Moldova | 97.0 /100 | #91 | Exceptional 48.0% |
| Palestinians | 96.9 /100 | #92 | Exceptional 48.0% |
| Lebanese | 96.9 /100 | #93 | Exceptional 47.9% |
| Americans | 96.9 /100 | #94 | Exceptional 47.9% |
| Immigrants | Belgium | 96.8 /100 | #95 | Exceptional 47.9% |
| Immigrants | Egypt | 96.6 /100 | #96 | Exceptional 47.9% |
| Latvians | 96.5 /100 | #97 | Exceptional 47.9% |
| Immigrants | North Macedonia | 96.4 /100 | #98 | Exceptional 47.9% |
| Immigrants | Austria | 96.4 /100 | #99 | Exceptional 47.9% |
| Immigrants | Italy | 96.3 /100 | #100 | Exceptional 47.9% |
| Turks | 96.1 /100 | #101 | Exceptional 47.8% |
| Slavs | 96.0 /100 | #102 | Exceptional 47.8% |
Demographics Similar to Colville by Married-couple Households
In terms of married-couple households, the demographic groups most similar to Colville are African (40.9%, a difference of 0.090%), Immigrants from Haiti (40.9%, a difference of 0.15%), Jamaican (40.9%, a difference of 0.22%), Trinidadian and Tobagonian (40.9%, a difference of 0.30%), and Immigrants from Caribbean (40.8%, a difference of 0.49%).
| Demographics | Rating | Rank | Married-couple Households |
| Immigrants | Guyana | 0.0 /100 | #304 | Tragic 41.6% |
| Sioux | 0.0 /100 | #305 | Tragic 41.5% |
| Guyanese | 0.0 /100 | #306 | Tragic 41.4% |
| Immigrants | Western Africa | 0.0 /100 | #307 | Tragic 41.4% |
| Crow | 0.0 /100 | #308 | Tragic 41.4% |
| Immigrants | Trinidad and Tobago | 0.0 /100 | #309 | Tragic 41.2% |
| Haitians | 0.0 /100 | #310 | Tragic 41.2% |
| Colville | 0.0 /100 | #311 | Tragic 41.0% |
| Africans | 0.0 /100 | #312 | Tragic 40.9% |
| Immigrants | Haiti | 0.0 /100 | #313 | Tragic 40.9% |
| Jamaicans | 0.0 /100 | #314 | Tragic 40.9% |
| Trinidadians and Tobagonians | 0.0 /100 | #315 | Tragic 40.9% |
| Immigrants | Caribbean | 0.0 /100 | #316 | Tragic 40.8% |
| Immigrants | Jamaica | 0.0 /100 | #317 | Tragic 40.7% |
| Liberians | 0.0 /100 | #318 | Tragic 40.7% |