Immigrants from Syria vs Thai In Labor Force | Age 25-29
COMPARE
Immigrants from Syria
Thai
In Labor Force | Age 25-29
In Labor Force | Age 25-29 Comparison
Immigrants from Syria
Thais
84.3%
IN LABOR FORCE | AGE 25-29
10.7/ 100
METRIC RATING
215th/ 347
METRIC RANK
85.5%
IN LABOR FORCE | AGE 25-29
99.5/ 100
METRIC RATING
60th/ 347
METRIC RANK
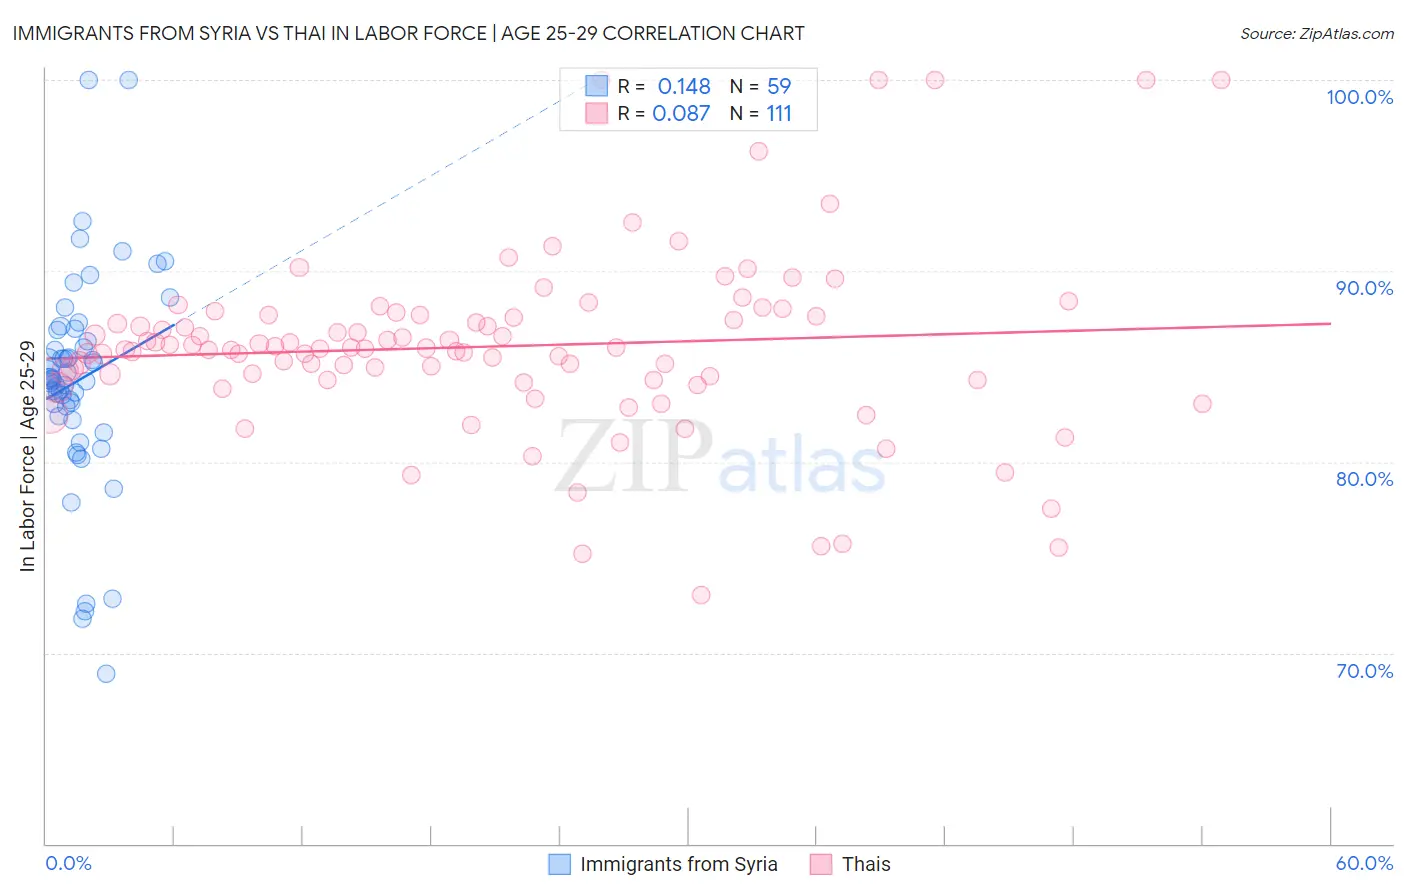
Immigrants from Syria vs Thai In Labor Force | Age 25-29 Correlation Chart
The statistical analysis conducted on geographies consisting of 174,092,146 people shows a poor positive correlation between the proportion of Immigrants from Syria and labor force participation rate among population between the ages 25 and 29 in the United States with a correlation coefficient (R) of 0.148 and weighted average of 84.3%. Similarly, the statistical analysis conducted on geographies consisting of 475,509,685 people shows a slight positive correlation between the proportion of Thais and labor force participation rate among population between the ages 25 and 29 in the United States with a correlation coefficient (R) of 0.087 and weighted average of 85.5%, a difference of 1.3%.
In Labor Force | Age 25-29 Correlation Summary
| Measurement | Immigrants from Syria | Thai |
| Minimum | 68.9% | 73.0% |
| Maximum | 100.0% | 100.0% |
| Range | 31.1% | 27.0% |
| Mean | 84.3% | 86.0% |
| Median | 84.4% | 85.9% |
| Interquartile 25% (IQ1) | 82.4% | 84.3% |
| Interquartile 75% (IQ3) | 86.9% | 87.7% |
| Interquartile Range (IQR) | 4.6% | 3.4% |
| Standard Deviation (Sample) | 5.7% | 4.8% |
| Standard Deviation (Population) | 5.6% | 4.8% |
Similar Demographics by In Labor Force | Age 25-29
Demographics Similar to Immigrants from Syria by In Labor Force | Age 25-29
In terms of in labor force | age 25-29, the demographic groups most similar to Immigrants from Syria are Japanese (84.3%, a difference of 0.010%), Lebanese (84.3%, a difference of 0.010%), Subsaharan African (84.3%, a difference of 0.020%), Chinese (84.3%, a difference of 0.030%), and Immigrants from Venezuela (84.3%, a difference of 0.030%).
| Demographics | Rating | Rank | In Labor Force | Age 25-29 |
| Immigrants | Indonesia | 13.2 /100 | #208 | Poor 84.4% |
| Immigrants | Jordan | 12.8 /100 | #209 | Poor 84.4% |
| Chinese | 12.7 /100 | #210 | Poor 84.3% |
| Immigrants | Venezuela | 12.6 /100 | #211 | Poor 84.3% |
| Sub-Saharan Africans | 11.7 /100 | #212 | Poor 84.3% |
| Japanese | 11.4 /100 | #213 | Poor 84.3% |
| Lebanese | 11.1 /100 | #214 | Poor 84.3% |
| Immigrants | Syria | 10.7 /100 | #215 | Poor 84.3% |
| Israelis | 9.3 /100 | #216 | Tragic 84.3% |
| Immigrants | Ecuador | 9.3 /100 | #217 | Tragic 84.3% |
| Immigrants | Nigeria | 9.0 /100 | #218 | Tragic 84.3% |
| Immigrants | Saudi Arabia | 8.8 /100 | #219 | Tragic 84.3% |
| Nigerians | 7.2 /100 | #220 | Tragic 84.3% |
| Arabs | 6.8 /100 | #221 | Tragic 84.2% |
| Jordanians | 6.7 /100 | #222 | Tragic 84.2% |
Demographics Similar to Thais by In Labor Force | Age 25-29
In terms of in labor force | age 25-29, the demographic groups most similar to Thais are Serbian (85.5%, a difference of 0.0%), Taiwanese (85.4%, a difference of 0.020%), Immigrants from Kenya (85.4%, a difference of 0.020%), Immigrants from Morocco (85.5%, a difference of 0.030%), and Estonian (85.5%, a difference of 0.040%).
| Demographics | Rating | Rank | In Labor Force | Age 25-29 |
| Belgians | 99.7 /100 | #53 | Exceptional 85.5% |
| Albanians | 99.7 /100 | #54 | Exceptional 85.5% |
| Immigrants | Brazil | 99.7 /100 | #55 | Exceptional 85.5% |
| Eastern Europeans | 99.6 /100 | #56 | Exceptional 85.5% |
| Estonians | 99.6 /100 | #57 | Exceptional 85.5% |
| Greeks | 99.6 /100 | #58 | Exceptional 85.5% |
| Immigrants | Morocco | 99.5 /100 | #59 | Exceptional 85.5% |
| Thais | 99.5 /100 | #60 | Exceptional 85.5% |
| Serbians | 99.5 /100 | #61 | Exceptional 85.5% |
| Taiwanese | 99.4 /100 | #62 | Exceptional 85.4% |
| Immigrants | Kenya | 99.4 /100 | #63 | Exceptional 85.4% |
| Immigrants | Italy | 99.3 /100 | #64 | Exceptional 85.4% |
| Immigrants | Czechoslovakia | 99.3 /100 | #65 | Exceptional 85.4% |
| Immigrants | Scotland | 99.3 /100 | #66 | Exceptional 85.4% |
| Immigrants | Turkey | 99.2 /100 | #67 | Exceptional 85.4% |