Immigrants from Syria vs Immigrants from Kuwait In Labor Force | Age 20-24
COMPARE
Immigrants from Syria
Immigrants from Kuwait
In Labor Force | Age 20-24
In Labor Force | Age 20-24 Comparison
Immigrants from Syria
Immigrants from Kuwait
74.0%
IN LABOR FORCE | AGE 20-24
1.9/ 100
METRIC RATING
243rd/ 347
METRIC RANK
74.5%
IN LABOR FORCE | AGE 20-24
12.7/ 100
METRIC RATING
216th/ 347
METRIC RANK
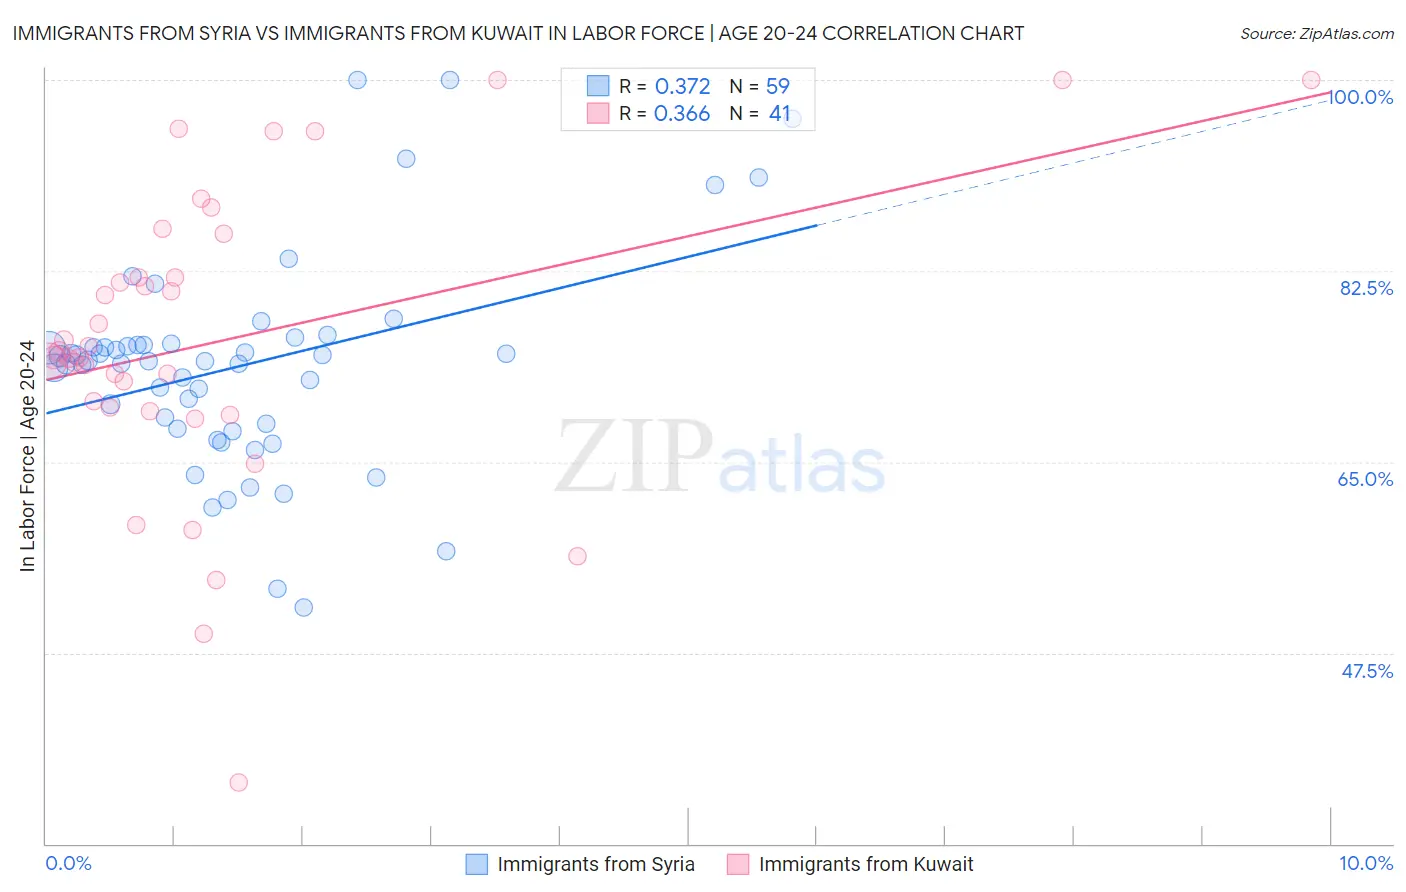
Immigrants from Syria vs Immigrants from Kuwait In Labor Force | Age 20-24 Correlation Chart
The statistical analysis conducted on geographies consisting of 174,096,608 people shows a mild positive correlation between the proportion of Immigrants from Syria and labor force participation rate among population between the ages 20 and 24 in the United States with a correlation coefficient (R) of 0.372 and weighted average of 74.0%. Similarly, the statistical analysis conducted on geographies consisting of 136,915,063 people shows a mild positive correlation between the proportion of Immigrants from Kuwait and labor force participation rate among population between the ages 20 and 24 in the United States with a correlation coefficient (R) of 0.366 and weighted average of 74.5%, a difference of 0.75%.
In Labor Force | Age 20-24 Correlation Summary
| Measurement | Immigrants from Syria | Immigrants from Kuwait |
| Minimum | 51.7% | 35.6% |
| Maximum | 100.0% | 100.0% |
| Range | 48.3% | 64.4% |
| Mean | 73.8% | 76.1% |
| Median | 74.2% | 74.6% |
| Interquartile 25% (IQ1) | 68.0% | 69.8% |
| Interquartile 75% (IQ3) | 75.7% | 83.9% |
| Interquartile Range (IQR) | 7.7% | 14.1% |
| Standard Deviation (Sample) | 9.7% | 13.9% |
| Standard Deviation (Population) | 9.6% | 13.7% |
Similar Demographics by In Labor Force | Age 20-24
Demographics Similar to Immigrants from Syria by In Labor Force | Age 20-24
In terms of in labor force | age 20-24, the demographic groups most similar to Immigrants from Syria are Immigrants from South Central Asia (74.0%, a difference of 0.010%), Thai (74.0%, a difference of 0.030%), Turkish (73.9%, a difference of 0.030%), Immigrants from Senegal (74.0%, a difference of 0.040%), and Immigrants from Sri Lanka (74.0%, a difference of 0.070%).
| Demographics | Rating | Rank | In Labor Force | Age 20-24 |
| Immigrants | France | 3.3 /100 | #236 | Tragic 74.1% |
| Bermudans | 3.2 /100 | #237 | Tragic 74.1% |
| Immigrants | Japan | 3.0 /100 | #238 | Tragic 74.1% |
| Immigrants | Latin America | 2.7 /100 | #239 | Tragic 74.1% |
| Immigrants | Sri Lanka | 2.3 /100 | #240 | Tragic 74.0% |
| Immigrants | Senegal | 2.1 /100 | #241 | Tragic 74.0% |
| Thais | 2.1 /100 | #242 | Tragic 74.0% |
| Immigrants | Syria | 1.9 /100 | #243 | Tragic 74.0% |
| Immigrants | South Central Asia | 1.9 /100 | #244 | Tragic 74.0% |
| Turks | 1.8 /100 | #245 | Tragic 73.9% |
| Immigrants | Panama | 1.6 /100 | #246 | Tragic 73.9% |
| Colville | 1.5 /100 | #247 | Tragic 73.9% |
| Immigrants | Saudi Arabia | 1.5 /100 | #248 | Tragic 73.9% |
| Blacks/African Americans | 1.3 /100 | #249 | Tragic 73.9% |
| Immigrants | Belgium | 1.3 /100 | #250 | Tragic 73.9% |
Demographics Similar to Immigrants from Kuwait by In Labor Force | Age 20-24
In terms of in labor force | age 20-24, the demographic groups most similar to Immigrants from Kuwait are Immigrants from Ghana (74.5%, a difference of 0.0%), Chilean (74.5%, a difference of 0.010%), Creek (74.5%, a difference of 0.020%), Peruvian (74.5%, a difference of 0.020%), and Immigrants from Southern Europe (74.5%, a difference of 0.020%).
| Demographics | Rating | Rank | In Labor Force | Age 20-24 |
| Arabs | 15.8 /100 | #209 | Poor 74.6% |
| Uruguayans | 15.1 /100 | #210 | Poor 74.6% |
| Immigrants | Australia | 14.7 /100 | #211 | Poor 74.6% |
| Creek | 13.3 /100 | #212 | Poor 74.5% |
| Peruvians | 13.3 /100 | #213 | Poor 74.5% |
| Immigrants | Southern Europe | 13.2 /100 | #214 | Poor 74.5% |
| Immigrants | Ghana | 12.7 /100 | #215 | Poor 74.5% |
| Immigrants | Kuwait | 12.7 /100 | #216 | Poor 74.5% |
| Chileans | 12.5 /100 | #217 | Poor 74.5% |
| Immigrants | Peru | 10.6 /100 | #218 | Poor 74.5% |
| Nepalese | 10.5 /100 | #219 | Poor 74.5% |
| Immigrants | Norway | 10.3 /100 | #220 | Poor 74.5% |
| Chickasaw | 10.3 /100 | #221 | Poor 74.5% |
| Immigrants | India | 9.9 /100 | #222 | Tragic 74.4% |
| Hispanics or Latinos | 7.9 /100 | #223 | Tragic 74.4% |