Immigrants from Sudan vs Ugandan Average Family Size
COMPARE
Immigrants from Sudan
Ugandan
Average Family Size
Average Family Size Comparison
Immigrants from Sudan
Ugandans
3.22
AVERAGE FAMILY SIZE
29.1/ 100
METRIC RATING
194th/ 347
METRIC RANK
3.23
AVERAGE FAMILY SIZE
58.4/ 100
METRIC RATING
165th/ 347
METRIC RANK
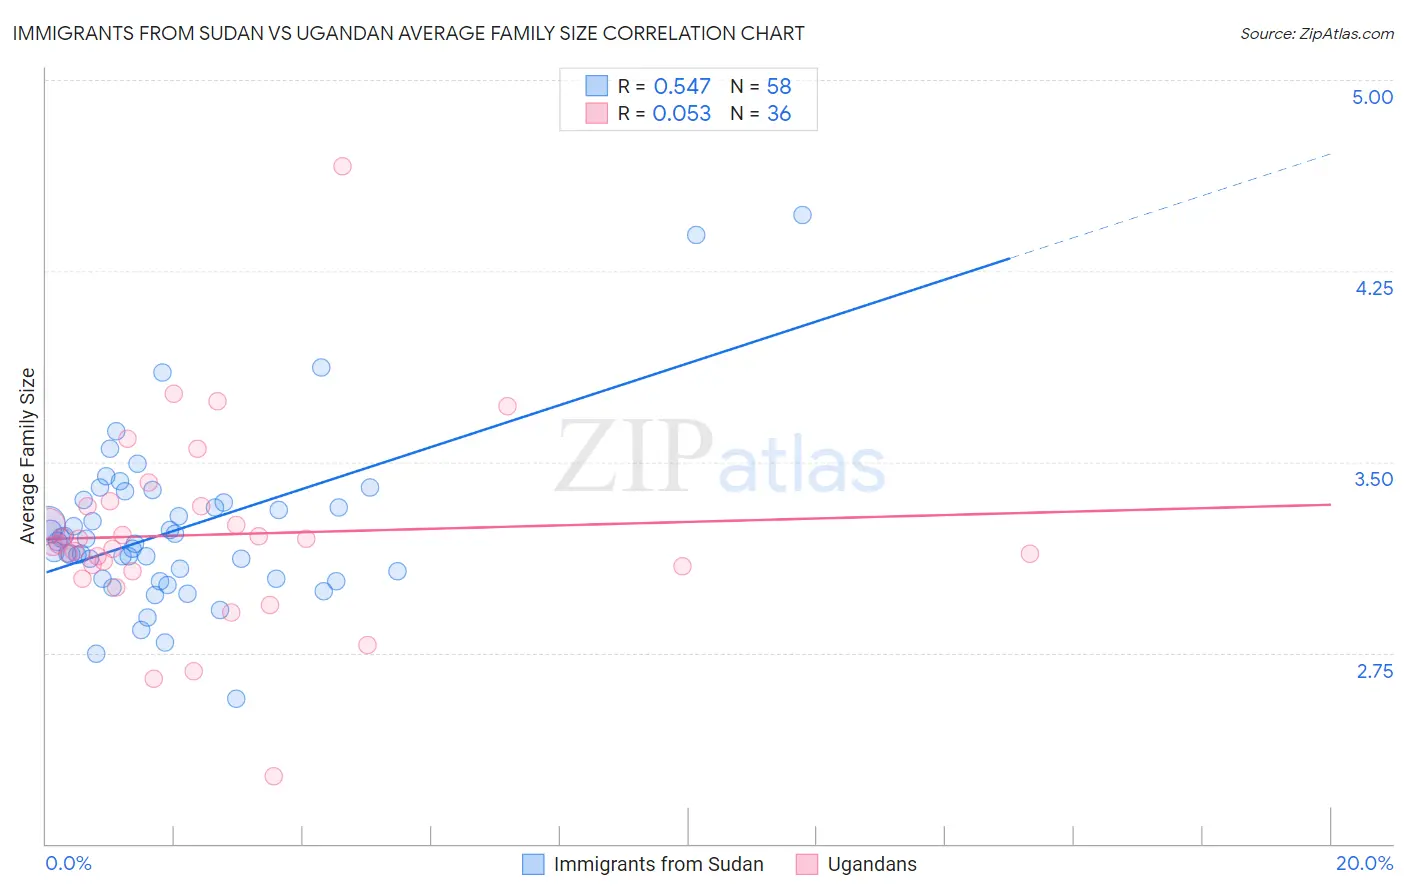
Immigrants from Sudan vs Ugandan Average Family Size Correlation Chart
The statistical analysis conducted on geographies consisting of 118,946,972 people shows a substantial positive correlation between the proportion of Immigrants from Sudan and average family size in the United States with a correlation coefficient (R) of 0.547 and weighted average of 3.22. Similarly, the statistical analysis conducted on geographies consisting of 93,998,632 people shows a slight positive correlation between the proportion of Ugandans and average family size in the United States with a correlation coefficient (R) of 0.053 and weighted average of 3.23, a difference of 0.56%.
Average Family Size Correlation Summary
| Measurement | Immigrants from Sudan | Ugandan |
| Minimum | 2.57 | 2.26 |
| Maximum | 4.47 | 4.66 |
| Range | 1.90 | 2.40 |
| Mean | 3.23 | 3.21 |
| Median | 3.18 | 3.17 |
| Interquartile 25% (IQ1) | 3.04 | 3.08 |
| Interquartile 75% (IQ3) | 3.34 | 3.33 |
| Interquartile Range (IQR) | 0.30 | 0.25 |
| Standard Deviation (Sample) | 0.33 | 0.39 |
| Standard Deviation (Population) | 0.32 | 0.38 |
Similar Demographics by Average Family Size
Demographics Similar to Immigrants from Sudan by Average Family Size
In terms of average family size, the demographic groups most similar to Immigrants from Sudan are Immigrants from Israel (3.22, a difference of 0.0%), Immigrants from Eastern Africa (3.22, a difference of 0.020%), Choctaw (3.21, a difference of 0.020%), Senegalese (3.21, a difference of 0.020%), and Kenyan (3.21, a difference of 0.020%).
| Demographics | Rating | Rank | Average Family Size |
| Immigrants | Malaysia | 39.0 /100 | #187 | Fair 3.22 |
| Thais | 38.3 /100 | #188 | Fair 3.22 |
| Pakistanis | 33.7 /100 | #189 | Fair 3.22 |
| Burmese | 31.0 /100 | #190 | Fair 3.22 |
| Immigrants | Zaire | 30.5 /100 | #191 | Fair 3.22 |
| Immigrants | Eastern Africa | 30.1 /100 | #192 | Fair 3.22 |
| Immigrants | Israel | 29.3 /100 | #193 | Fair 3.22 |
| Immigrants | Sudan | 29.1 /100 | #194 | Fair 3.22 |
| Choctaw | 28.3 /100 | #195 | Fair 3.21 |
| Senegalese | 28.2 /100 | #196 | Fair 3.21 |
| Kenyans | 28.0 /100 | #197 | Fair 3.21 |
| Immigrants | Azores | 21.7 /100 | #198 | Fair 3.21 |
| Hmong | 20.7 /100 | #199 | Fair 3.21 |
| Immigrants | Kenya | 19.2 /100 | #200 | Poor 3.21 |
| Immigrants | Morocco | 18.5 /100 | #201 | Poor 3.21 |
Demographics Similar to Ugandans by Average Family Size
In terms of average family size, the demographic groups most similar to Ugandans are Egyptian (3.23, a difference of 0.0%), Uruguayan (3.23, a difference of 0.010%), Immigrants from Senegal (3.23, a difference of 0.020%), Immigrants from Uganda (3.23, a difference of 0.030%), and Dutch West Indian (3.23, a difference of 0.030%).
| Demographics | Rating | Rank | Average Family Size |
| Iraqis | 64.3 /100 | #158 | Good 3.24 |
| Ethiopians | 63.9 /100 | #159 | Good 3.24 |
| Immigrants | Iraq | 63.7 /100 | #160 | Good 3.24 |
| Immigrants | Chile | 63.2 /100 | #161 | Good 3.24 |
| Immigrants | Uganda | 60.1 /100 | #162 | Good 3.23 |
| Uruguayans | 58.8 /100 | #163 | Average 3.23 |
| Egyptians | 58.6 /100 | #164 | Average 3.23 |
| Ugandans | 58.4 /100 | #165 | Average 3.23 |
| Immigrants | Senegal | 57.5 /100 | #166 | Average 3.23 |
| Dutch West Indians | 56.9 /100 | #167 | Average 3.23 |
| Taiwanese | 54.2 /100 | #168 | Average 3.23 |
| Aleuts | 54.1 /100 | #169 | Average 3.23 |
| Arabs | 53.8 /100 | #170 | Average 3.23 |
| Chileans | 53.2 /100 | #171 | Average 3.23 |
| Immigrants | Congo | 52.7 /100 | #172 | Average 3.23 |