Immigrants from Sri Lanka vs Immigrants from Sierra Leone 7th Grade
COMPARE
Immigrants from Sri Lanka
Immigrants from Sierra Leone
7th Grade
7th Grade Comparison
Immigrants from Sri Lanka
Immigrants from Sierra Leone
96.1%
7TH GRADE
59.9/ 100
METRIC RATING
167th/ 347
METRIC RANK
95.5%
7TH GRADE
2.0/ 100
METRIC RATING
240th/ 347
METRIC RANK
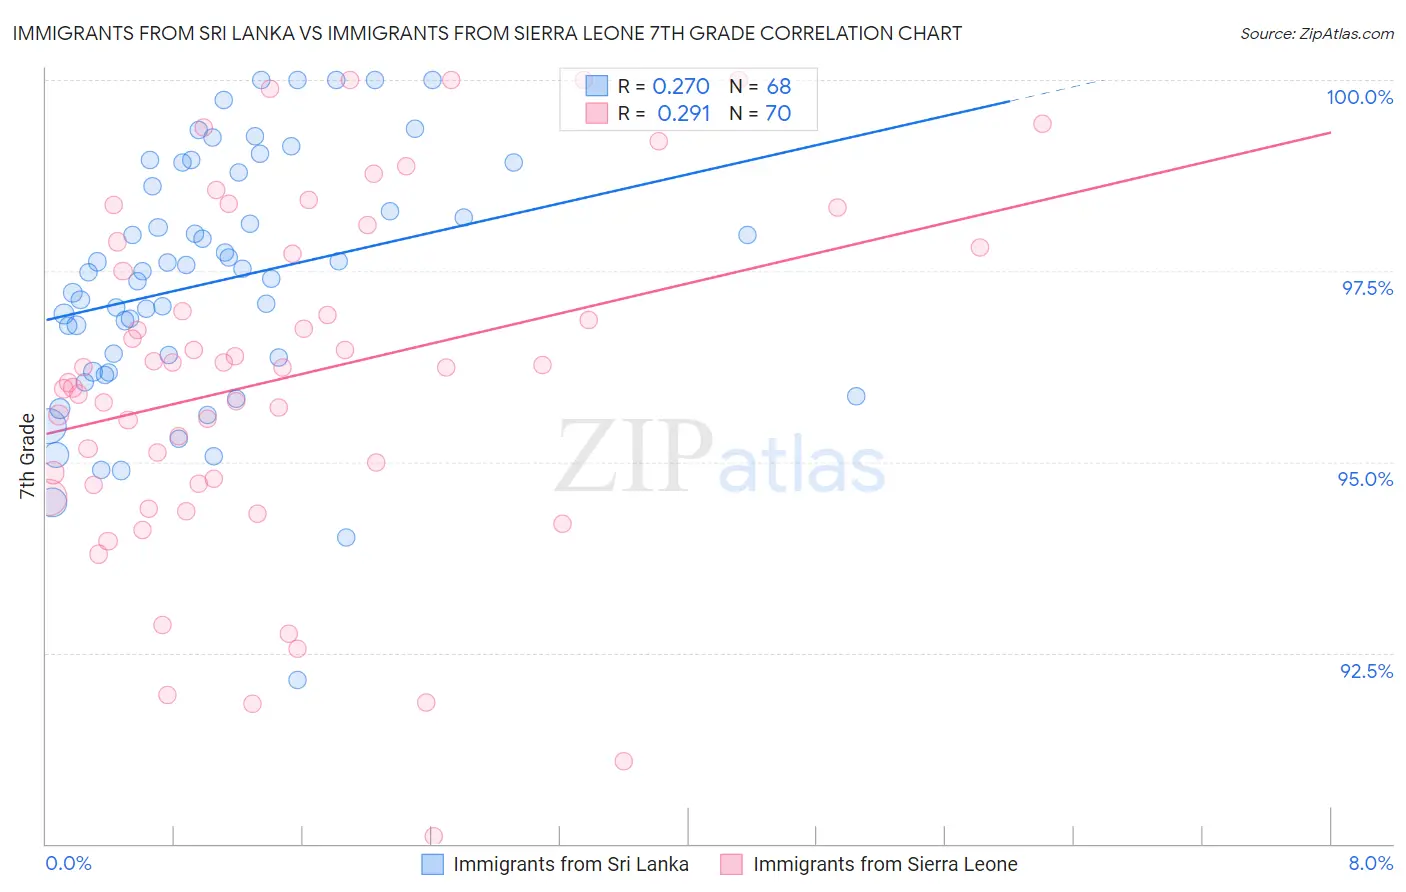
Immigrants from Sri Lanka vs Immigrants from Sierra Leone 7th Grade Correlation Chart
The statistical analysis conducted on geographies consisting of 149,660,761 people shows a weak positive correlation between the proportion of Immigrants from Sri Lanka and percentage of population with at least 7th grade education in the United States with a correlation coefficient (R) of 0.270 and weighted average of 96.1%. Similarly, the statistical analysis conducted on geographies consisting of 101,634,956 people shows a weak positive correlation between the proportion of Immigrants from Sierra Leone and percentage of population with at least 7th grade education in the United States with a correlation coefficient (R) of 0.291 and weighted average of 95.5%, a difference of 0.66%.
7th Grade Correlation Summary
| Measurement | Immigrants from Sri Lanka | Immigrants from Sierra Leone |
| Minimum | 92.1% | 90.1% |
| Maximum | 100.0% | 100.0% |
| Range | 7.9% | 9.9% |
| Mean | 97.4% | 96.1% |
| Median | 97.5% | 96.2% |
| Interquartile 25% (IQ1) | 96.3% | 94.7% |
| Interquartile 75% (IQ3) | 98.7% | 97.8% |
| Interquartile Range (IQR) | 2.4% | 3.1% |
| Standard Deviation (Sample) | 1.6% | 2.3% |
| Standard Deviation (Population) | 1.6% | 2.3% |
Similar Demographics by 7th Grade
Demographics Similar to Immigrants from Sri Lanka by 7th Grade
In terms of 7th grade, the demographic groups most similar to Immigrants from Sri Lanka are Immigrants from Italy (96.1%, a difference of 0.010%), Immigrants from Taiwan (96.1%, a difference of 0.010%), Immigrants from Kazakhstan (96.1%, a difference of 0.010%), Immigrants from Poland (96.1%, a difference of 0.010%), and Spaniard (96.1%, a difference of 0.020%).
| Demographics | Rating | Rank | 7th Grade |
| Immigrants | Kenya | 66.8 /100 | #160 | Good 96.1% |
| Bermudans | 66.3 /100 | #161 | Good 96.1% |
| Pima | 64.3 /100 | #162 | Good 96.1% |
| Spaniards | 62.6 /100 | #163 | Good 96.1% |
| Immigrants | Italy | 62.1 /100 | #164 | Good 96.1% |
| Immigrants | Taiwan | 61.5 /100 | #165 | Good 96.1% |
| Immigrants | Kazakhstan | 61.0 /100 | #166 | Good 96.1% |
| Immigrants | Sri Lanka | 59.9 /100 | #167 | Average 96.1% |
| Immigrants | Poland | 59.0 /100 | #168 | Average 96.1% |
| Ute | 55.8 /100 | #169 | Average 96.1% |
| Immigrants | Ukraine | 55.0 /100 | #170 | Average 96.1% |
| Egyptians | 54.2 /100 | #171 | Average 96.1% |
| Venezuelans | 51.4 /100 | #172 | Average 96.0% |
| Immigrants | Albania | 50.4 /100 | #173 | Average 96.0% |
| Mongolians | 50.0 /100 | #174 | Average 96.0% |
Demographics Similar to Immigrants from Sierra Leone by 7th Grade
In terms of 7th grade, the demographic groups most similar to Immigrants from Sierra Leone are South American Indian (95.5%, a difference of 0.0%), Immigrants from Senegal (95.5%, a difference of 0.0%), Indian (Asian) (95.5%, a difference of 0.020%), Jamaican (95.5%, a difference of 0.020%), and Immigrants from Asia (95.5%, a difference of 0.030%).
| Demographics | Rating | Rank | 7th Grade |
| Immigrants | Indonesia | 3.3 /100 | #233 | Tragic 95.5% |
| Nigerians | 3.0 /100 | #234 | Tragic 95.5% |
| Immigrants | Africa | 2.7 /100 | #235 | Tragic 95.5% |
| Asians | 2.6 /100 | #236 | Tragic 95.5% |
| Immigrants | Asia | 2.3 /100 | #237 | Tragic 95.5% |
| Indians (Asian) | 2.3 /100 | #238 | Tragic 95.5% |
| Jamaicans | 2.2 /100 | #239 | Tragic 95.5% |
| Immigrants | Sierra Leone | 2.0 /100 | #240 | Tragic 95.5% |
| South American Indians | 2.0 /100 | #241 | Tragic 95.5% |
| Immigrants | Senegal | 1.9 /100 | #242 | Tragic 95.5% |
| U.S. Virgin Islanders | 1.6 /100 | #243 | Tragic 95.4% |
| Uruguayans | 1.6 /100 | #244 | Tragic 95.4% |
| Immigrants | Middle Africa | 1.5 /100 | #245 | Tragic 95.4% |
| Ethiopians | 1.5 /100 | #246 | Tragic 95.4% |
| Tongans | 1.3 /100 | #247 | Tragic 95.4% |