Immigrants from South Eastern Asia vs Native Hawaiian 1st Grade
COMPARE
Immigrants from South Eastern Asia
Native Hawaiian
1st Grade
1st Grade Comparison
Immigrants from South Eastern Asia
Native Hawaiians
97.1%
1ST GRADE
0.0/ 100
METRIC RATING
301st/ 347
METRIC RANK
98.5%
1ST GRADE
99.9/ 100
METRIC RATING
42nd/ 347
METRIC RANK
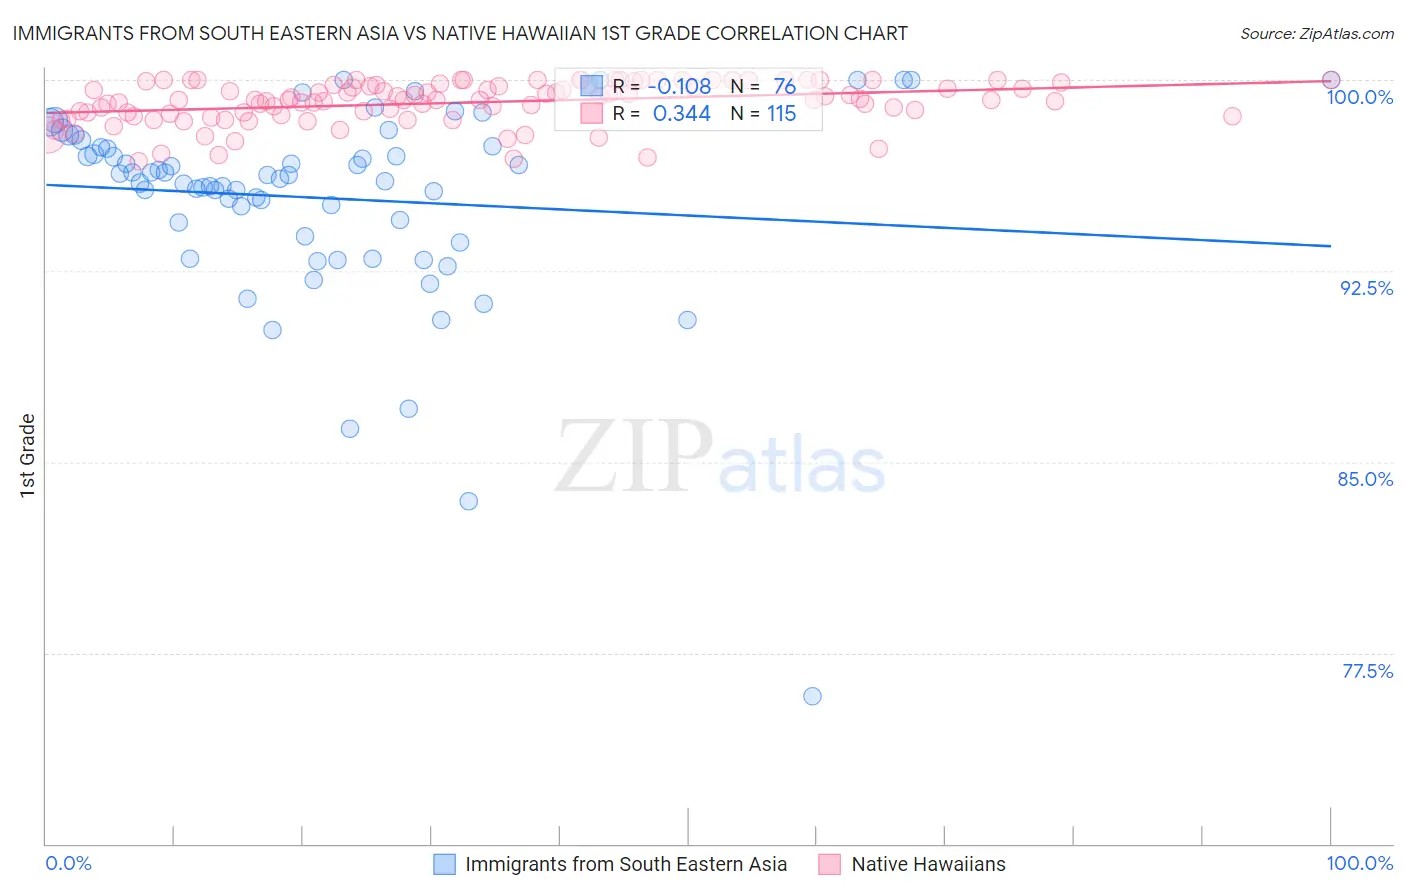
Immigrants from South Eastern Asia vs Native Hawaiian 1st Grade Correlation Chart
The statistical analysis conducted on geographies consisting of 512,710,277 people shows a poor negative correlation between the proportion of Immigrants from South Eastern Asia and percentage of population with at least 1st grade education in the United States with a correlation coefficient (R) of -0.108 and weighted average of 97.1%. Similarly, the statistical analysis conducted on geographies consisting of 332,114,626 people shows a mild positive correlation between the proportion of Native Hawaiians and percentage of population with at least 1st grade education in the United States with a correlation coefficient (R) of 0.344 and weighted average of 98.5%, a difference of 1.4%.
1st Grade Correlation Summary
| Measurement | Immigrants from South Eastern Asia | Native Hawaiian |
| Minimum | 75.8% | 96.8% |
| Maximum | 100.0% | 100.0% |
| Range | 24.2% | 3.2% |
| Mean | 95.4% | 99.1% |
| Median | 96.2% | 99.2% |
| Interquartile 25% (IQ1) | 94.2% | 98.6% |
| Interquartile 75% (IQ3) | 97.4% | 99.8% |
| Interquartile Range (IQR) | 3.2% | 1.2% |
| Standard Deviation (Sample) | 3.9% | 0.81% |
| Standard Deviation (Population) | 3.9% | 0.81% |
Similar Demographics by 1st Grade
Demographics Similar to Immigrants from South Eastern Asia by 1st Grade
In terms of 1st grade, the demographic groups most similar to Immigrants from South Eastern Asia are Immigrants from Caribbean (97.0%, a difference of 0.020%), Haitian (97.1%, a difference of 0.030%), Immigrants from Dominica (97.1%, a difference of 0.040%), Immigrants from Cuba (97.1%, a difference of 0.040%), and Somali (97.0%, a difference of 0.050%).
| Demographics | Rating | Rank | 1st Grade |
| Immigrants | Grenada | 0.0 /100 | #294 | Tragic 97.2% |
| Immigrants | Immigrants | 0.0 /100 | #295 | Tragic 97.2% |
| Immigrants | Eritrea | 0.0 /100 | #296 | Tragic 97.2% |
| Central American Indians | 0.0 /100 | #297 | Tragic 97.1% |
| Immigrants | Dominica | 0.0 /100 | #298 | Tragic 97.1% |
| Immigrants | Cuba | 0.0 /100 | #299 | Tragic 97.1% |
| Haitians | 0.0 /100 | #300 | Tragic 97.1% |
| Immigrants | South Eastern Asia | 0.0 /100 | #301 | Tragic 97.1% |
| Immigrants | Caribbean | 0.0 /100 | #302 | Tragic 97.0% |
| Somalis | 0.0 /100 | #303 | Tragic 97.0% |
| Nicaraguans | 0.0 /100 | #304 | Tragic 97.0% |
| Ecuadorians | 0.0 /100 | #305 | Tragic 97.0% |
| Belizeans | 0.0 /100 | #306 | Tragic 96.9% |
| Immigrants | Somalia | 0.0 /100 | #307 | Tragic 96.9% |
| Hispanics or Latinos | 0.0 /100 | #308 | Tragic 96.9% |
Demographics Similar to Native Hawaiians by 1st Grade
In terms of 1st grade, the demographic groups most similar to Native Hawaiians are Eastern European (98.5%, a difference of 0.0%), Lumbee (98.5%, a difference of 0.0%), Luxembourger (98.5%, a difference of 0.010%), Northern European (98.5%, a difference of 0.010%), and Belgian (98.4%, a difference of 0.010%).
| Demographics | Rating | Rank | 1st Grade |
| Chinese | 100.0 /100 | #35 | Exceptional 98.5% |
| British | 100.0 /100 | #36 | Exceptional 98.5% |
| Italians | 99.9 /100 | #37 | Exceptional 98.5% |
| Chippewa | 99.9 /100 | #38 | Exceptional 98.5% |
| Latvians | 99.9 /100 | #39 | Exceptional 98.5% |
| Luxembourgers | 99.9 /100 | #40 | Exceptional 98.5% |
| Eastern Europeans | 99.9 /100 | #41 | Exceptional 98.5% |
| Native Hawaiians | 99.9 /100 | #42 | Exceptional 98.5% |
| Lumbee | 99.9 /100 | #43 | Exceptional 98.5% |
| Northern Europeans | 99.9 /100 | #44 | Exceptional 98.5% |
| Belgians | 99.9 /100 | #45 | Exceptional 98.4% |
| Hungarians | 99.9 /100 | #46 | Exceptional 98.4% |
| Ottawa | 99.8 /100 | #47 | Exceptional 98.4% |
| Czechoslovakians | 99.8 /100 | #48 | Exceptional 98.4% |
| Celtics | 99.8 /100 | #49 | Exceptional 98.4% |