Immigrants from South Central Asia vs Immigrants from Thailand Currently Married
COMPARE
Immigrants from South Central Asia
Immigrants from Thailand
Currently Married
Currently Married Comparison
Immigrants from South Central Asia
Immigrants from Thailand
50.0%
CURRENTLY MARRIED
100.0/ 100
METRIC RATING
7th/ 347
METRIC RANK
45.4%
CURRENTLY MARRIED
5.1/ 100
METRIC RATING
217th/ 347
METRIC RANK
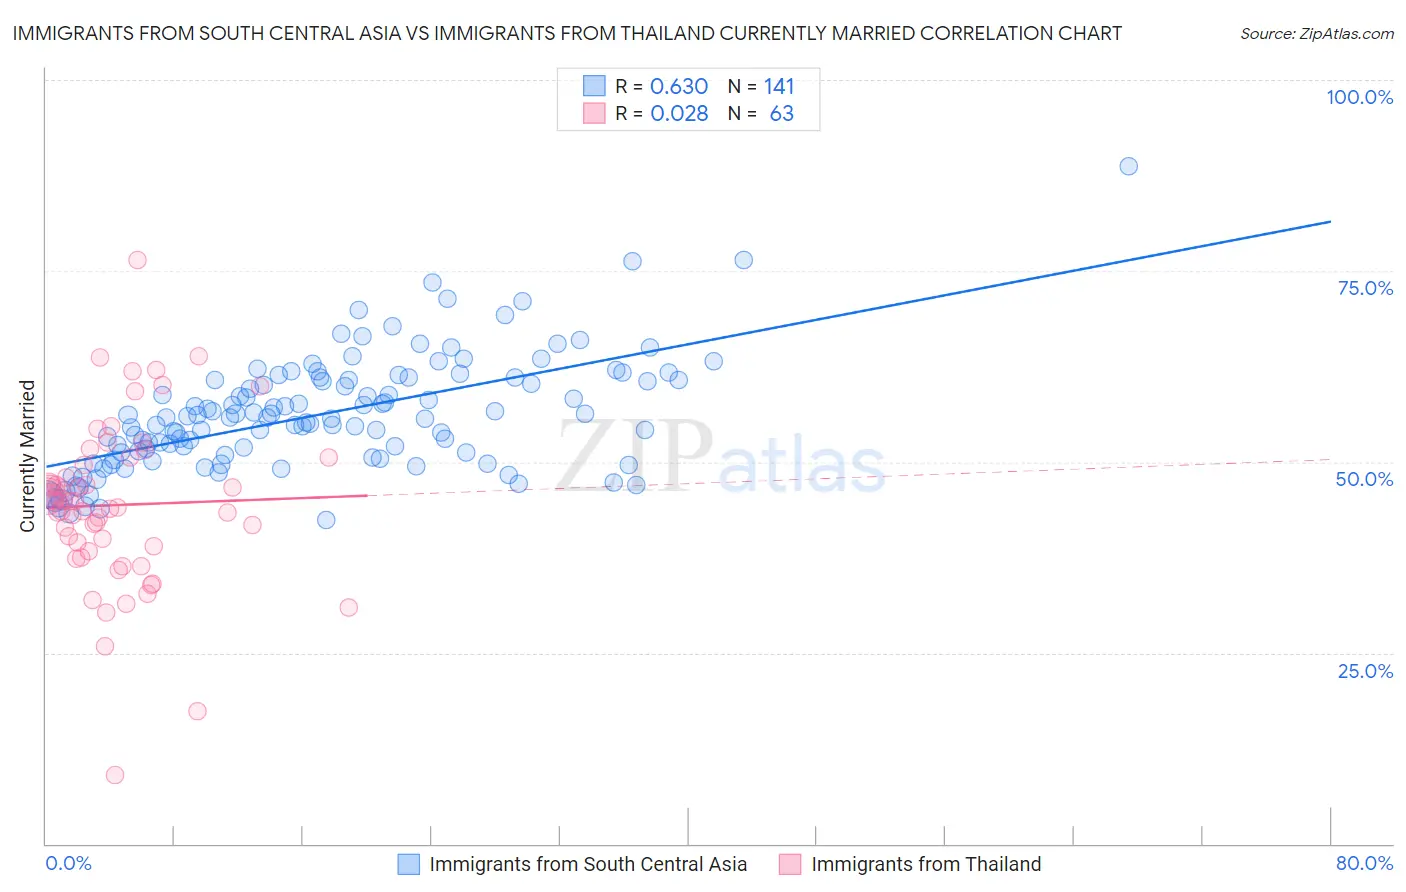
Immigrants from South Central Asia vs Immigrants from Thailand Currently Married Correlation Chart
The statistical analysis conducted on geographies consisting of 473,021,987 people shows a significant positive correlation between the proportion of Immigrants from South Central Asia and percentage of population currently married in the United States with a correlation coefficient (R) of 0.630 and weighted average of 50.0%. Similarly, the statistical analysis conducted on geographies consisting of 316,997,410 people shows no correlation between the proportion of Immigrants from Thailand and percentage of population currently married in the United States with a correlation coefficient (R) of 0.028 and weighted average of 45.4%, a difference of 10.2%.
Currently Married Correlation Summary
| Measurement | Immigrants from South Central Asia | Immigrants from Thailand |
| Minimum | 42.4% | 9.0% |
| Maximum | 88.7% | 76.5% |
| Range | 46.3% | 67.5% |
| Mean | 56.2% | 44.4% |
| Median | 55.8% | 44.1% |
| Interquartile 25% (IQ1) | 50.7% | 38.3% |
| Interquartile 75% (IQ3) | 60.7% | 50.6% |
| Interquartile Range (IQR) | 10.0% | 12.3% |
| Standard Deviation (Sample) | 7.4% | 11.0% |
| Standard Deviation (Population) | 7.4% | 11.0% |
Similar Demographics by Currently Married
Demographics Similar to Immigrants from South Central Asia by Currently Married
In terms of currently married, the demographic groups most similar to Immigrants from South Central Asia are Swedish (50.0%, a difference of 0.13%), Czech (49.9%, a difference of 0.32%), Norwegian (50.2%, a difference of 0.34%), Filipino (49.7%, a difference of 0.58%), and English (49.7%, a difference of 0.59%).
| Demographics | Rating | Rank | Currently Married |
| Immigrants | India | 100.0 /100 | #1 | Exceptional 51.8% |
| Thais | 100.0 /100 | #2 | Exceptional 50.9% |
| Assyrians/Chaldeans/Syriacs | 100.0 /100 | #3 | Exceptional 50.8% |
| Immigrants | Taiwan | 100.0 /100 | #4 | Exceptional 50.7% |
| Danes | 100.0 /100 | #5 | Exceptional 50.5% |
| Norwegians | 100.0 /100 | #6 | Exceptional 50.2% |
| Immigrants | South Central Asia | 100.0 /100 | #7 | Exceptional 50.0% |
| Swedes | 100.0 /100 | #8 | Exceptional 50.0% |
| Czechs | 99.9 /100 | #9 | Exceptional 49.9% |
| Filipinos | 99.9 /100 | #10 | Exceptional 49.7% |
| English | 99.9 /100 | #11 | Exceptional 49.7% |
| Swiss | 99.9 /100 | #12 | Exceptional 49.7% |
| Dutch | 99.9 /100 | #13 | Exceptional 49.6% |
| Germans | 99.9 /100 | #14 | Exceptional 49.6% |
| Pennsylvania Germans | 99.9 /100 | #15 | Exceptional 49.6% |
Demographics Similar to Immigrants from Thailand by Currently Married
In terms of currently married, the demographic groups most similar to Immigrants from Thailand are Immigrants from Morocco (45.4%, a difference of 0.080%), Panamanian (45.3%, a difference of 0.24%), Dutch West Indian (45.5%, a difference of 0.28%), German Russian (45.5%, a difference of 0.28%), and Alaska Native (45.5%, a difference of 0.32%).
| Demographics | Rating | Rank | Currently Married |
| Uruguayans | 7.9 /100 | #210 | Tragic 45.6% |
| Houma | 7.2 /100 | #211 | Tragic 45.5% |
| Marshallese | 7.2 /100 | #212 | Tragic 45.5% |
| Alaska Natives | 7.0 /100 | #213 | Tragic 45.5% |
| Dutch West Indians | 6.7 /100 | #214 | Tragic 45.5% |
| German Russians | 6.7 /100 | #215 | Tragic 45.5% |
| Immigrants | Morocco | 5.5 /100 | #216 | Tragic 45.4% |
| Immigrants | Thailand | 5.1 /100 | #217 | Tragic 45.4% |
| Panamanians | 4.0 /100 | #218 | Tragic 45.3% |
| Immigrants | Portugal | 3.5 /100 | #219 | Tragic 45.2% |
| Kenyans | 3.1 /100 | #220 | Tragic 45.2% |
| Mexicans | 3.0 /100 | #221 | Tragic 45.2% |
| Immigrants | Azores | 2.5 /100 | #222 | Tragic 45.1% |
| Immigrants | Laos | 2.3 /100 | #223 | Tragic 45.0% |
| Immigrants | Uganda | 2.2 /100 | #224 | Tragic 45.0% |