Immigrants from South Central Asia vs Yuman Currently Married
COMPARE
Immigrants from South Central Asia
Yuman
Currently Married
Currently Married Comparison
Immigrants from South Central Asia
Yuman
50.0%
CURRENTLY MARRIED
100.0/ 100
METRIC RATING
7th/ 347
METRIC RANK
42.6%
CURRENTLY MARRIED
0.0/ 100
METRIC RATING
293rd/ 347
METRIC RANK
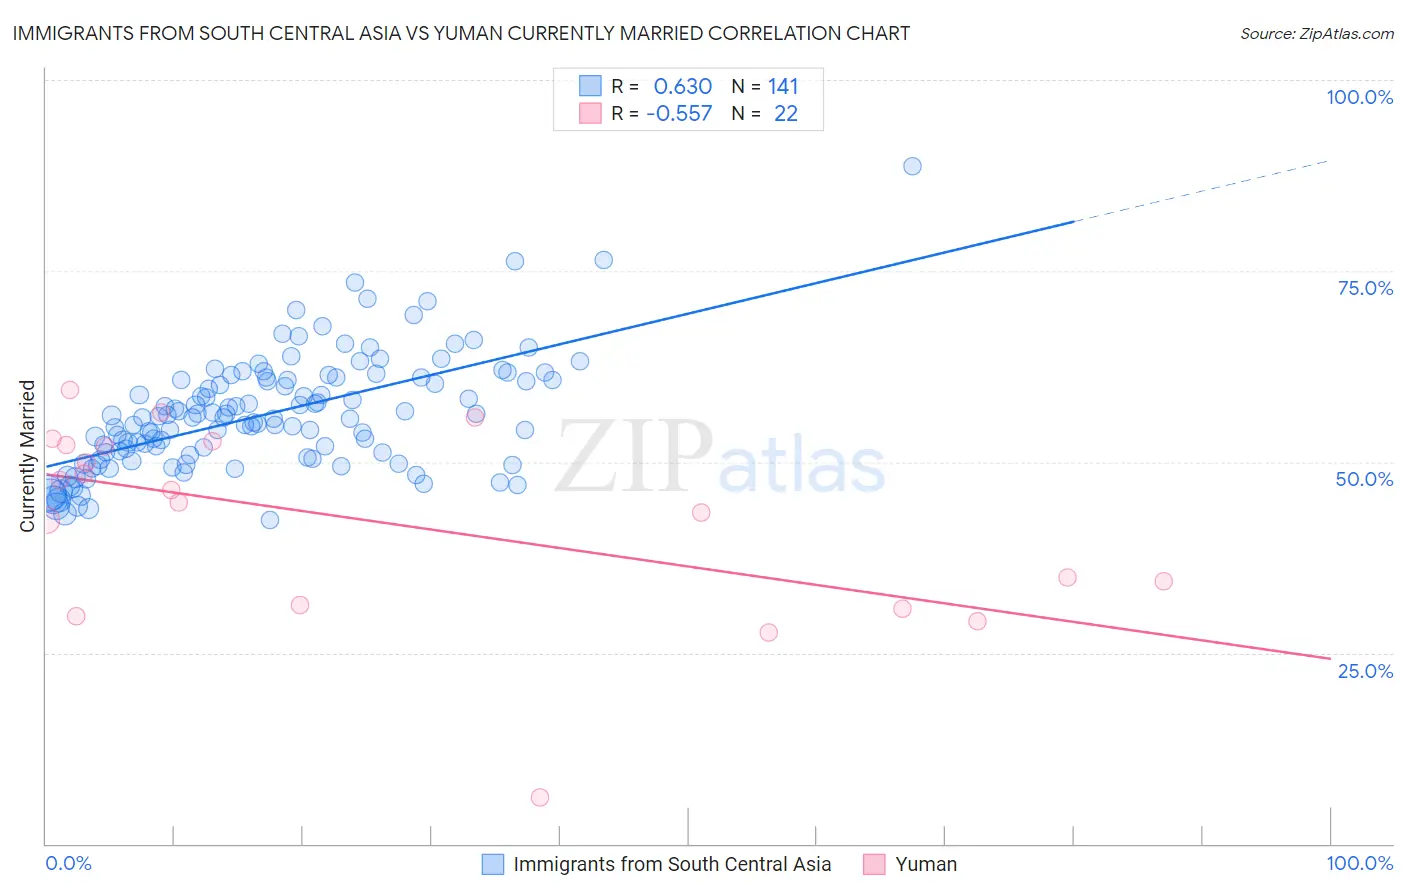
Immigrants from South Central Asia vs Yuman Currently Married Correlation Chart
The statistical analysis conducted on geographies consisting of 473,021,987 people shows a significant positive correlation between the proportion of Immigrants from South Central Asia and percentage of population currently married in the United States with a correlation coefficient (R) of 0.630 and weighted average of 50.0%. Similarly, the statistical analysis conducted on geographies consisting of 40,696,202 people shows a substantial negative correlation between the proportion of Yuman and percentage of population currently married in the United States with a correlation coefficient (R) of -0.557 and weighted average of 42.6%, a difference of 17.5%.
Currently Married Correlation Summary
| Measurement | Immigrants from South Central Asia | Yuman |
| Minimum | 42.4% | 6.1% |
| Maximum | 88.7% | 59.4% |
| Range | 46.3% | 53.3% |
| Mean | 56.2% | 42.2% |
| Median | 55.8% | 45.5% |
| Interquartile 25% (IQ1) | 50.7% | 31.2% |
| Interquartile 75% (IQ3) | 60.7% | 52.2% |
| Interquartile Range (IQR) | 10.0% | 21.0% |
| Standard Deviation (Sample) | 7.4% | 12.8% |
| Standard Deviation (Population) | 7.4% | 12.5% |
Similar Demographics by Currently Married
Demographics Similar to Immigrants from South Central Asia by Currently Married
In terms of currently married, the demographic groups most similar to Immigrants from South Central Asia are Swedish (50.0%, a difference of 0.13%), Czech (49.9%, a difference of 0.32%), Norwegian (50.2%, a difference of 0.34%), Filipino (49.7%, a difference of 0.58%), and English (49.7%, a difference of 0.59%).
| Demographics | Rating | Rank | Currently Married |
| Immigrants | India | 100.0 /100 | #1 | Exceptional 51.8% |
| Thais | 100.0 /100 | #2 | Exceptional 50.9% |
| Assyrians/Chaldeans/Syriacs | 100.0 /100 | #3 | Exceptional 50.8% |
| Immigrants | Taiwan | 100.0 /100 | #4 | Exceptional 50.7% |
| Danes | 100.0 /100 | #5 | Exceptional 50.5% |
| Norwegians | 100.0 /100 | #6 | Exceptional 50.2% |
| Immigrants | South Central Asia | 100.0 /100 | #7 | Exceptional 50.0% |
| Swedes | 100.0 /100 | #8 | Exceptional 50.0% |
| Czechs | 99.9 /100 | #9 | Exceptional 49.9% |
| Filipinos | 99.9 /100 | #10 | Exceptional 49.7% |
| English | 99.9 /100 | #11 | Exceptional 49.7% |
| Swiss | 99.9 /100 | #12 | Exceptional 49.7% |
| Dutch | 99.9 /100 | #13 | Exceptional 49.6% |
| Germans | 99.9 /100 | #14 | Exceptional 49.6% |
| Pennsylvania Germans | 99.9 /100 | #15 | Exceptional 49.6% |
Demographics Similar to Yuman by Currently Married
In terms of currently married, the demographic groups most similar to Yuman are Subsaharan African (42.6%, a difference of 0.020%), Honduran (42.5%, a difference of 0.12%), Immigrants from Guatemala (42.6%, a difference of 0.18%), Immigrants from Ghana (42.7%, a difference of 0.29%), and Paiute (42.7%, a difference of 0.30%).
| Demographics | Rating | Rank | Currently Married |
| Ghanaians | 0.0 /100 | #286 | Tragic 42.9% |
| Guatemalans | 0.0 /100 | #287 | Tragic 42.9% |
| Natives/Alaskans | 0.0 /100 | #288 | Tragic 42.8% |
| Paiute | 0.0 /100 | #289 | Tragic 42.7% |
| Immigrants | Ghana | 0.0 /100 | #290 | Tragic 42.7% |
| Immigrants | Guatemala | 0.0 /100 | #291 | Tragic 42.6% |
| Sub-Saharan Africans | 0.0 /100 | #292 | Tragic 42.6% |
| Yuman | 0.0 /100 | #293 | Tragic 42.6% |
| Hondurans | 0.0 /100 | #294 | Tragic 42.5% |
| Immigrants | Western Africa | 0.0 /100 | #295 | Tragic 42.4% |
| Menominee | 0.0 /100 | #296 | Tragic 42.3% |
| Cheyenne | 0.0 /100 | #297 | Tragic 42.2% |
| Immigrants | Honduras | 0.0 /100 | #298 | Tragic 42.2% |
| Liberians | 0.0 /100 | #299 | Tragic 42.2% |
| Belizeans | 0.0 /100 | #300 | Tragic 42.2% |