Immigrants from South Central Asia vs Afghan Hearing Disability
COMPARE
Immigrants from South Central Asia
Afghan
Hearing Disability
Hearing Disability Comparison
Immigrants from South Central Asia
Afghans
2.6%
HEARING DISABILITY
99.7/ 100
METRIC RATING
27th/ 347
METRIC RANK
2.7%
HEARING DISABILITY
97.6/ 100
METRIC RATING
72nd/ 347
METRIC RANK
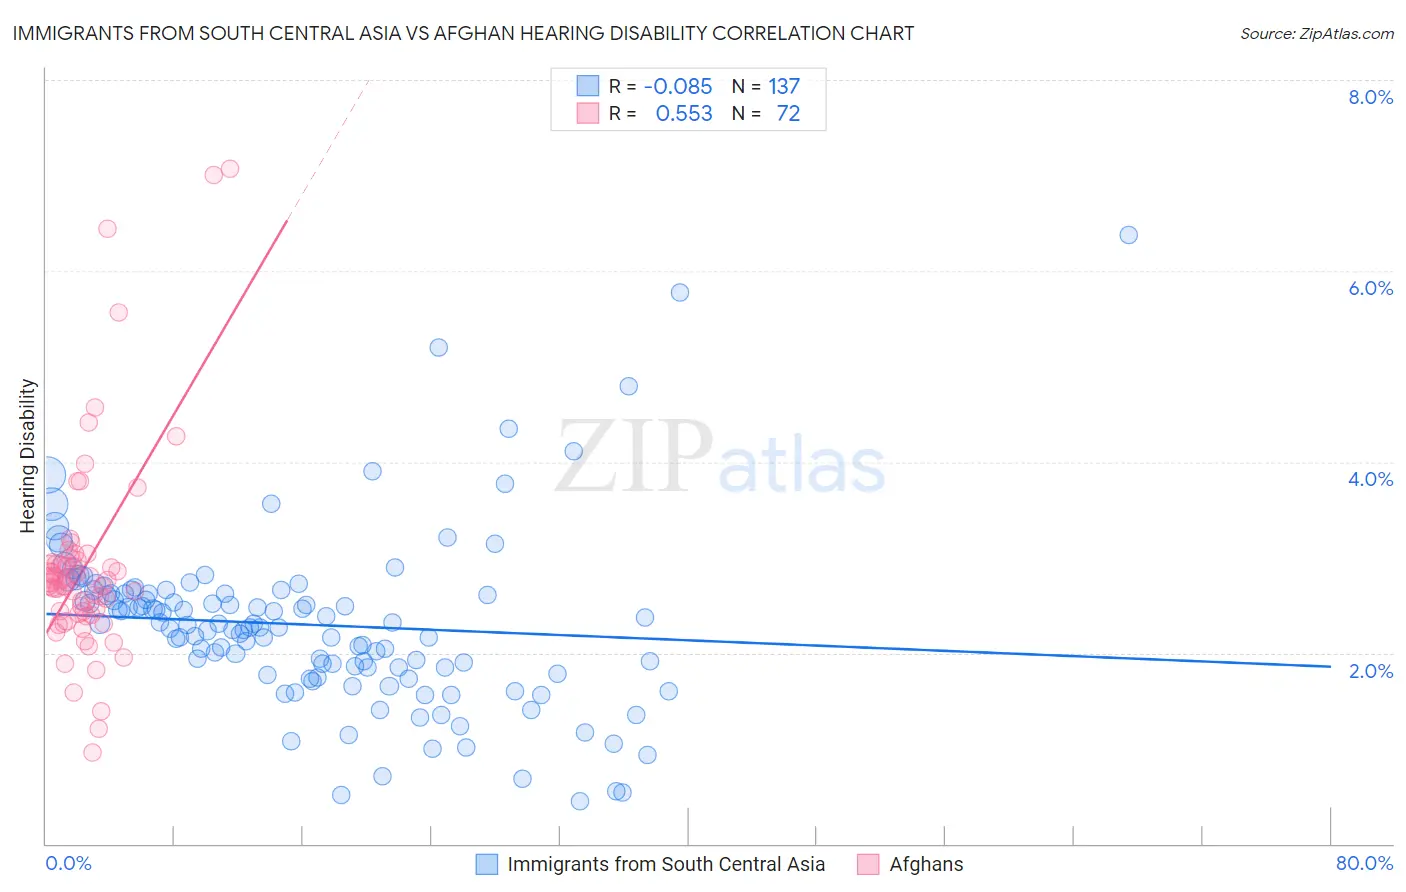
Immigrants from South Central Asia vs Afghan Hearing Disability Correlation Chart
The statistical analysis conducted on geographies consisting of 472,823,945 people shows a slight negative correlation between the proportion of Immigrants from South Central Asia and percentage of population with hearing disability in the United States with a correlation coefficient (R) of -0.085 and weighted average of 2.6%. Similarly, the statistical analysis conducted on geographies consisting of 148,839,750 people shows a substantial positive correlation between the proportion of Afghans and percentage of population with hearing disability in the United States with a correlation coefficient (R) of 0.553 and weighted average of 2.7%, a difference of 5.9%.
Hearing Disability Correlation Summary
| Measurement | Immigrants from South Central Asia | Afghan |
| Minimum | 0.44% | 0.95% |
| Maximum | 6.4% | 7.1% |
| Range | 5.9% | 6.1% |
| Mean | 2.3% | 2.9% |
| Median | 2.3% | 2.7% |
| Interquartile 25% (IQ1) | 1.8% | 2.4% |
| Interquartile 75% (IQ3) | 2.6% | 3.0% |
| Interquartile Range (IQR) | 0.81% | 0.55% |
| Standard Deviation (Sample) | 0.91% | 1.1% |
| Standard Deviation (Population) | 0.91% | 1.1% |
Similar Demographics by Hearing Disability
Demographics Similar to Immigrants from South Central Asia by Hearing Disability
In terms of hearing disability, the demographic groups most similar to Immigrants from South Central Asia are Immigrants from Senegal (2.6%, a difference of 0.040%), Immigrants from El Salvador (2.6%, a difference of 0.050%), Immigrants from Haiti (2.6%, a difference of 0.37%), Bolivian (2.6%, a difference of 0.40%), and Immigrants from Ghana (2.6%, a difference of 0.45%).
| Demographics | Rating | Rank | Hearing Disability |
| Immigrants | Bolivia | 99.8 /100 | #20 | Exceptional 2.5% |
| Ghanaians | 99.8 /100 | #21 | Exceptional 2.5% |
| Immigrants | Sierra Leone | 99.8 /100 | #22 | Exceptional 2.6% |
| Immigrants | Nigeria | 99.8 /100 | #23 | Exceptional 2.6% |
| Immigrants | Ghana | 99.8 /100 | #24 | Exceptional 2.6% |
| Immigrants | El Salvador | 99.7 /100 | #25 | Exceptional 2.6% |
| Immigrants | Senegal | 99.7 /100 | #26 | Exceptional 2.6% |
| Immigrants | South Central Asia | 99.7 /100 | #27 | Exceptional 2.6% |
| Immigrants | Haiti | 99.7 /100 | #28 | Exceptional 2.6% |
| Bolivians | 99.7 /100 | #29 | Exceptional 2.6% |
| Immigrants | Caribbean | 99.7 /100 | #30 | Exceptional 2.6% |
| Immigrants | Cameroon | 99.7 /100 | #31 | Exceptional 2.6% |
| Immigrants | Venezuela | 99.7 /100 | #32 | Exceptional 2.6% |
| Filipinos | 99.6 /100 | #33 | Exceptional 2.6% |
| Immigrants | Pakistan | 99.6 /100 | #34 | Exceptional 2.6% |
Demographics Similar to Afghans by Hearing Disability
In terms of hearing disability, the demographic groups most similar to Afghans are Argentinean (2.7%, a difference of 0.080%), Immigrants from Korea (2.7%, a difference of 0.080%), Central American (2.7%, a difference of 0.10%), Immigrants from Saudi Arabia (2.7%, a difference of 0.11%), and Asian (2.7%, a difference of 0.11%).
| Demographics | Rating | Rank | Hearing Disability |
| Immigrants | Nepal | 98.3 /100 | #65 | Exceptional 2.7% |
| Immigrants | Belize | 98.2 /100 | #66 | Exceptional 2.7% |
| Egyptians | 98.1 /100 | #67 | Exceptional 2.7% |
| Immigrants | Africa | 98.0 /100 | #68 | Exceptional 2.7% |
| Nicaraguans | 97.9 /100 | #69 | Exceptional 2.7% |
| Peruvians | 97.7 /100 | #70 | Exceptional 2.7% |
| Central Americans | 97.7 /100 | #71 | Exceptional 2.7% |
| Afghans | 97.6 /100 | #72 | Exceptional 2.7% |
| Argentineans | 97.5 /100 | #73 | Exceptional 2.7% |
| Immigrants | Korea | 97.5 /100 | #74 | Exceptional 2.7% |
| Immigrants | Saudi Arabia | 97.5 /100 | #75 | Exceptional 2.7% |
| Asians | 97.5 /100 | #76 | Exceptional 2.7% |
| Immigrants | Malaysia | 97.5 /100 | #77 | Exceptional 2.7% |
| Mongolians | 97.4 /100 | #78 | Exceptional 2.7% |
| Colombians | 97.4 /100 | #79 | Exceptional 2.7% |