Immigrants from Somalia vs Alaska Native Family Households
COMPARE
Immigrants from Somalia
Alaska Native
Family Households
Family Households Comparison
Immigrants from Somalia
Alaska Natives
56.7%
FAMILY HOUSEHOLDS
0.0/ 100
METRIC RATING
347th/ 347
METRIC RANK
65.1%
FAMILY HOUSEHOLDS
97.3/ 100
METRIC RATING
107th/ 347
METRIC RANK
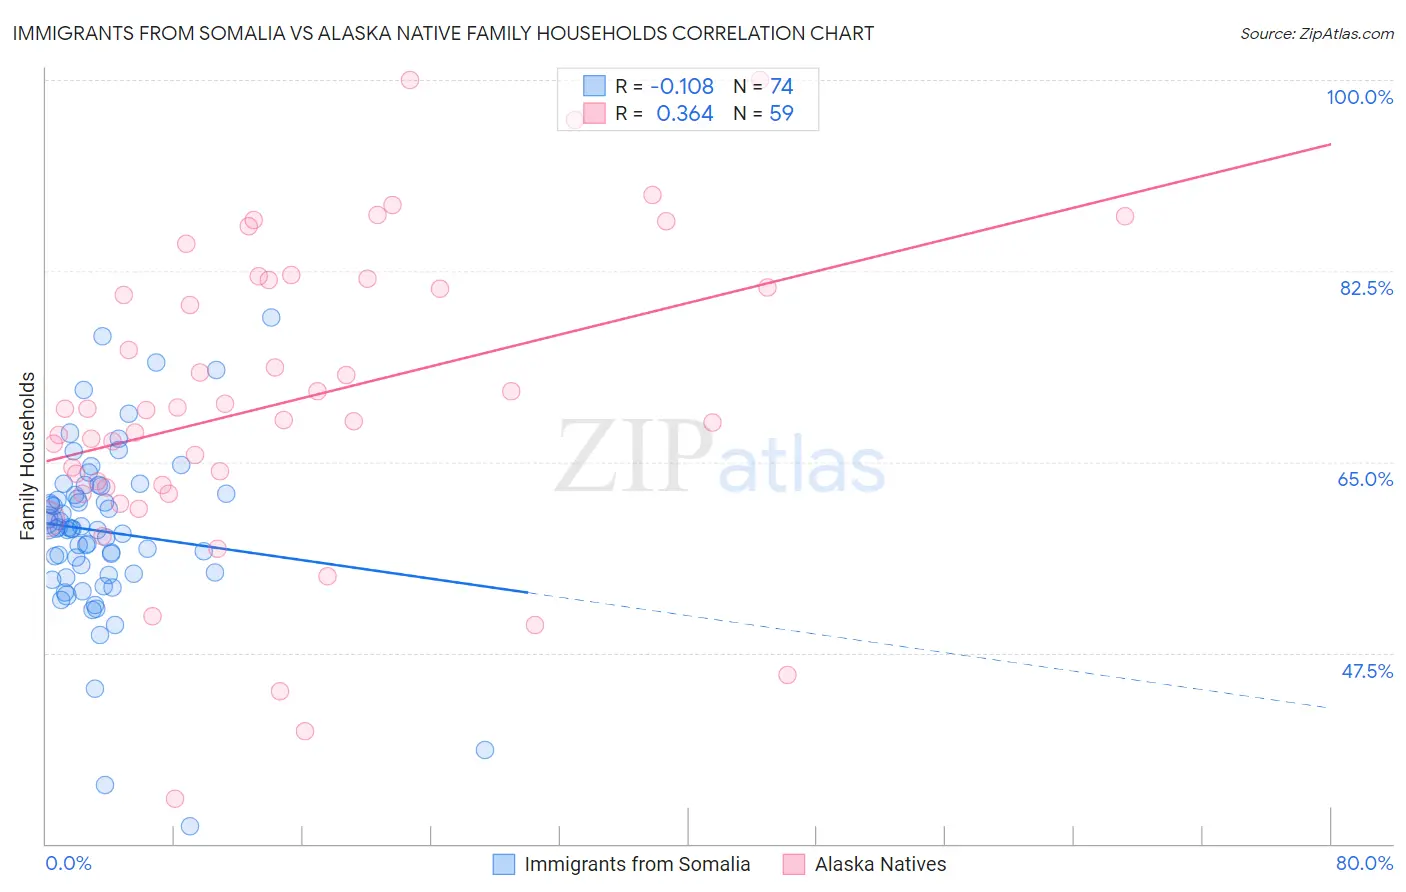
Immigrants from Somalia vs Alaska Native Family Households Correlation Chart
The statistical analysis conducted on geographies consisting of 92,092,225 people shows a poor negative correlation between the proportion of Immigrants from Somalia and percentage of family households in the United States with a correlation coefficient (R) of -0.108 and weighted average of 56.7%. Similarly, the statistical analysis conducted on geographies consisting of 76,756,415 people shows a mild positive correlation between the proportion of Alaska Natives and percentage of family households in the United States with a correlation coefficient (R) of 0.364 and weighted average of 65.1%, a difference of 14.8%.
Family Households Correlation Summary
| Measurement | Immigrants from Somalia | Alaska Native |
| Minimum | 31.6% | 34.1% |
| Maximum | 78.2% | 100.0% |
| Range | 46.6% | 65.9% |
| Mean | 58.6% | 70.5% |
| Median | 58.9% | 69.7% |
| Interquartile 25% (IQ1) | 54.8% | 62.6% |
| Interquartile 75% (IQ3) | 62.1% | 81.7% |
| Interquartile Range (IQR) | 7.3% | 19.1% |
| Standard Deviation (Sample) | 7.8% | 14.0% |
| Standard Deviation (Population) | 7.8% | 13.9% |
Similar Demographics by Family Households
Demographics Similar to Immigrants from Somalia by Family Households
In terms of family households, the demographic groups most similar to Immigrants from Somalia are Somali (57.6%, a difference of 1.7%), Immigrants from Zaire (59.2%, a difference of 4.4%), Immigrants from Congo (59.2%, a difference of 4.5%), Senegalese (59.8%, a difference of 5.6%), and Sudanese (60.0%, a difference of 5.9%).
| Demographics | Rating | Rank | Family Households |
| Immigrants | Ethiopia | 0.0 /100 | #333 | Tragic 61.2% |
| Immigrants | Eastern Africa | 0.0 /100 | #334 | Tragic 61.1% |
| Carpatho Rusyns | 0.0 /100 | #335 | Tragic 61.1% |
| German Russians | 0.0 /100 | #336 | Tragic 60.9% |
| Soviet Union | 0.0 /100 | #337 | Tragic 60.9% |
| Immigrants | Eritrea | 0.0 /100 | #338 | Tragic 60.8% |
| Immigrants | Saudi Arabia | 0.0 /100 | #339 | Tragic 60.7% |
| Immigrants | Sudan | 0.0 /100 | #340 | Tragic 60.2% |
| Immigrants | Senegal | 0.0 /100 | #341 | Tragic 60.1% |
| Sudanese | 0.0 /100 | #342 | Tragic 60.0% |
| Senegalese | 0.0 /100 | #343 | Tragic 59.8% |
| Immigrants | Congo | 0.0 /100 | #344 | Tragic 59.2% |
| Immigrants | Zaire | 0.0 /100 | #345 | Tragic 59.2% |
| Somalis | 0.0 /100 | #346 | Tragic 57.6% |
| Immigrants | Somalia | 0.0 /100 | #347 | Tragic 56.7% |
Demographics Similar to Alaska Natives by Family Households
In terms of family households, the demographic groups most similar to Alaska Natives are White/Caucasian (65.1%, a difference of 0.0%), English (65.1%, a difference of 0.010%), Palestinian (65.1%, a difference of 0.010%), Immigrants from Guatemala (65.0%, a difference of 0.050%), and Scandinavian (65.0%, a difference of 0.060%).
| Demographics | Rating | Rank | Family Households |
| Haitians | 98.1 /100 | #100 | Exceptional 65.2% |
| Chileans | 98.1 /100 | #101 | Exceptional 65.2% |
| Immigrants | Sri Lanka | 98.0 /100 | #102 | Exceptional 65.1% |
| Indians (Asian) | 97.9 /100 | #103 | Exceptional 65.1% |
| Spaniards | 97.8 /100 | #104 | Exceptional 65.1% |
| English | 97.4 /100 | #105 | Exceptional 65.1% |
| Whites/Caucasians | 97.3 /100 | #106 | Exceptional 65.1% |
| Alaska Natives | 97.3 /100 | #107 | Exceptional 65.1% |
| Palestinians | 97.2 /100 | #108 | Exceptional 65.1% |
| Immigrants | Guatemala | 96.9 /100 | #109 | Exceptional 65.0% |
| Scandinavians | 96.8 /100 | #110 | Exceptional 65.0% |
| Europeans | 96.8 /100 | #111 | Exceptional 65.0% |
| Immigrants | Jordan | 96.5 /100 | #112 | Exceptional 65.0% |
| Spanish | 96.2 /100 | #113 | Exceptional 65.0% |
| Argentineans | 95.7 /100 | #114 | Exceptional 65.0% |