Immigrants from Somalia vs Immigrants from Central America Family Households
COMPARE
Immigrants from Somalia
Immigrants from Central America
Family Households
Family Households Comparison
Immigrants from Somalia
Immigrants from Central America
56.7%
FAMILY HOUSEHOLDS
0.0/ 100
METRIC RATING
347th/ 347
METRIC RANK
68.3%
FAMILY HOUSEHOLDS
100.0/ 100
METRIC RATING
11th/ 347
METRIC RANK
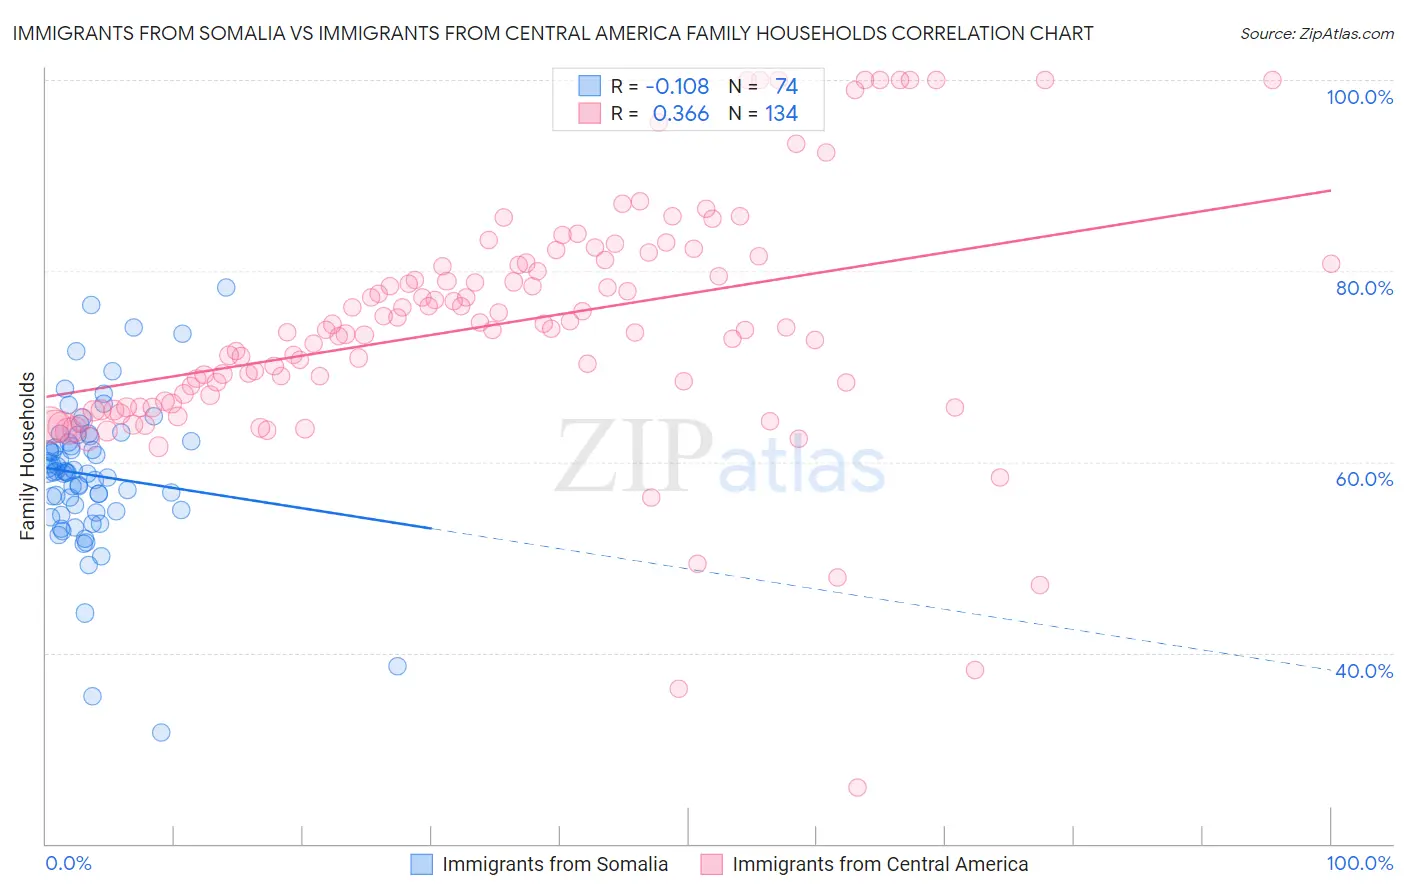
Immigrants from Somalia vs Immigrants from Central America Family Households Correlation Chart
The statistical analysis conducted on geographies consisting of 92,092,225 people shows a poor negative correlation between the proportion of Immigrants from Somalia and percentage of family households in the United States with a correlation coefficient (R) of -0.108 and weighted average of 56.7%. Similarly, the statistical analysis conducted on geographies consisting of 536,086,114 people shows a mild positive correlation between the proportion of Immigrants from Central America and percentage of family households in the United States with a correlation coefficient (R) of 0.366 and weighted average of 68.3%, a difference of 20.5%.
Family Households Correlation Summary
| Measurement | Immigrants from Somalia | Immigrants from Central America |
| Minimum | 31.6% | 25.8% |
| Maximum | 78.2% | 100.0% |
| Range | 46.6% | 74.2% |
| Mean | 58.6% | 74.3% |
| Median | 58.9% | 73.9% |
| Interquartile 25% (IQ1) | 54.8% | 66.1% |
| Interquartile 75% (IQ3) | 62.1% | 80.8% |
| Interquartile Range (IQR) | 7.3% | 14.7% |
| Standard Deviation (Sample) | 7.8% | 12.7% |
| Standard Deviation (Population) | 7.8% | 12.7% |
Similar Demographics by Family Households
Demographics Similar to Immigrants from Somalia by Family Households
In terms of family households, the demographic groups most similar to Immigrants from Somalia are Somali (57.6%, a difference of 1.7%), Immigrants from Zaire (59.2%, a difference of 4.4%), Immigrants from Congo (59.2%, a difference of 4.5%), Senegalese (59.8%, a difference of 5.6%), and Sudanese (60.0%, a difference of 5.9%).
| Demographics | Rating | Rank | Family Households |
| Immigrants | Ethiopia | 0.0 /100 | #333 | Tragic 61.2% |
| Immigrants | Eastern Africa | 0.0 /100 | #334 | Tragic 61.1% |
| Carpatho Rusyns | 0.0 /100 | #335 | Tragic 61.1% |
| German Russians | 0.0 /100 | #336 | Tragic 60.9% |
| Soviet Union | 0.0 /100 | #337 | Tragic 60.9% |
| Immigrants | Eritrea | 0.0 /100 | #338 | Tragic 60.8% |
| Immigrants | Saudi Arabia | 0.0 /100 | #339 | Tragic 60.7% |
| Immigrants | Sudan | 0.0 /100 | #340 | Tragic 60.2% |
| Immigrants | Senegal | 0.0 /100 | #341 | Tragic 60.1% |
| Sudanese | 0.0 /100 | #342 | Tragic 60.0% |
| Senegalese | 0.0 /100 | #343 | Tragic 59.8% |
| Immigrants | Congo | 0.0 /100 | #344 | Tragic 59.2% |
| Immigrants | Zaire | 0.0 /100 | #345 | Tragic 59.2% |
| Somalis | 0.0 /100 | #346 | Tragic 57.6% |
| Immigrants | Somalia | 0.0 /100 | #347 | Tragic 56.7% |
Demographics Similar to Immigrants from Central America by Family Households
In terms of family households, the demographic groups most similar to Immigrants from Central America are Korean (68.3%, a difference of 0.030%), Immigrants from Philippines (68.3%, a difference of 0.070%), Pueblo (68.2%, a difference of 0.11%), Immigrants from Cuba (68.2%, a difference of 0.12%), and Native Hawaiian (68.4%, a difference of 0.14%).
| Demographics | Rating | Rank | Family Households |
| Yakama | 100.0 /100 | #4 | Exceptional 69.3% |
| Yuman | 100.0 /100 | #5 | Exceptional 69.3% |
| Immigrants | Mexico | 100.0 /100 | #6 | Exceptional 69.1% |
| Mexicans | 100.0 /100 | #7 | Exceptional 69.0% |
| Immigrants | Fiji | 100.0 /100 | #8 | Exceptional 68.8% |
| Native Hawaiians | 100.0 /100 | #9 | Exceptional 68.4% |
| Immigrants | Philippines | 100.0 /100 | #10 | Exceptional 68.3% |
| Immigrants | Central America | 100.0 /100 | #11 | Exceptional 68.3% |
| Koreans | 100.0 /100 | #12 | Exceptional 68.3% |
| Pueblo | 100.0 /100 | #13 | Exceptional 68.2% |
| Immigrants | Cuba | 100.0 /100 | #14 | Exceptional 68.2% |
| Assyrians/Chaldeans/Syriacs | 100.0 /100 | #15 | Exceptional 68.2% |
| Immigrants | Vietnam | 100.0 /100 | #16 | Exceptional 68.2% |
| Chinese | 100.0 /100 | #17 | Exceptional 68.1% |
| Immigrants | Taiwan | 100.0 /100 | #18 | Exceptional 68.0% |