Immigrants from Somalia vs Immigrants from Burma/Myanmar Female Poverty Among 18-24 Year Olds
COMPARE
Immigrants from Somalia
Immigrants from Burma/Myanmar
Female Poverty Among 18-24 Year Olds
Female Poverty Among 18-24 Year Olds Comparison
Immigrants from Somalia
Immigrants from Burma/Myanmar
25.7%
FEMALE POVERTY AMONG 18-24 YEAR OLDS
0.0/ 100
METRIC RATING
330th/ 347
METRIC RANK
21.6%
FEMALE POVERTY AMONG 18-24 YEAR OLDS
0.2/ 100
METRIC RATING
268th/ 347
METRIC RANK
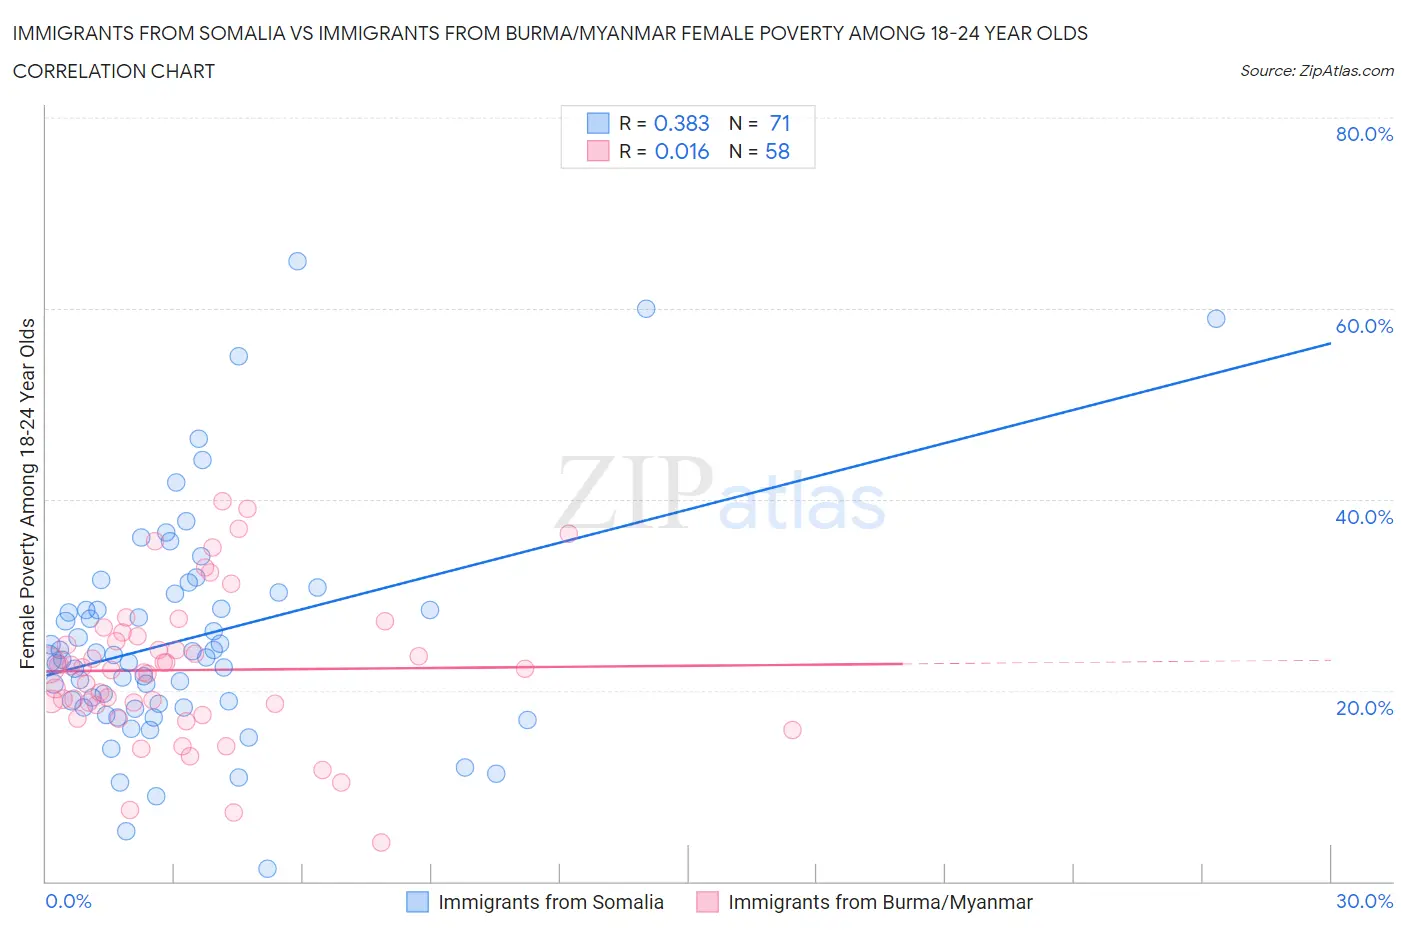
Immigrants from Somalia vs Immigrants from Burma/Myanmar Female Poverty Among 18-24 Year Olds Correlation Chart
The statistical analysis conducted on geographies consisting of 91,805,813 people shows a mild positive correlation between the proportion of Immigrants from Somalia and poverty level among females between the ages 18 and 24 in the United States with a correlation coefficient (R) of 0.383 and weighted average of 25.7%. Similarly, the statistical analysis conducted on geographies consisting of 170,928,474 people shows no correlation between the proportion of Immigrants from Burma/Myanmar and poverty level among females between the ages 18 and 24 in the United States with a correlation coefficient (R) of 0.016 and weighted average of 21.6%, a difference of 19.3%.
Female Poverty Among 18-24 Year Olds Correlation Summary
| Measurement | Immigrants from Somalia | Immigrants from Burma/Myanmar |
| Minimum | 1.4% | 4.1% |
| Maximum | 65.0% | 39.8% |
| Range | 63.6% | 35.7% |
| Mean | 25.5% | 22.1% |
| Median | 23.4% | 22.2% |
| Interquartile 25% (IQ1) | 18.3% | 18.4% |
| Interquartile 75% (IQ3) | 30.1% | 25.6% |
| Interquartile Range (IQR) | 11.8% | 7.2% |
| Standard Deviation (Sample) | 11.9% | 7.7% |
| Standard Deviation (Population) | 11.8% | 7.6% |
Similar Demographics by Female Poverty Among 18-24 Year Olds
Demographics Similar to Immigrants from Somalia by Female Poverty Among 18-24 Year Olds
In terms of female poverty among 18-24 year olds, the demographic groups most similar to Immigrants from Somalia are Cajun (25.7%, a difference of 0.21%), Chippewa (25.9%, a difference of 0.65%), Native/Alaskan (25.4%, a difference of 1.3%), Ute (25.4%, a difference of 1.4%), and Yakama (25.3%, a difference of 1.6%).
| Demographics | Rating | Rank | Female Poverty Among 18-24 Year Olds |
| Arapaho | 0.0 /100 | #323 | Tragic 25.2% |
| German Russians | 0.0 /100 | #324 | Tragic 25.2% |
| Immigrants | Saudi Arabia | 0.0 /100 | #325 | Tragic 25.3% |
| Yakama | 0.0 /100 | #326 | Tragic 25.3% |
| Ute | 0.0 /100 | #327 | Tragic 25.4% |
| Natives/Alaskans | 0.0 /100 | #328 | Tragic 25.4% |
| Cajuns | 0.0 /100 | #329 | Tragic 25.7% |
| Immigrants | Somalia | 0.0 /100 | #330 | Tragic 25.7% |
| Chippewa | 0.0 /100 | #331 | Tragic 25.9% |
| Houma | 0.0 /100 | #332 | Tragic 26.2% |
| Apache | 0.0 /100 | #333 | Tragic 26.3% |
| Pueblo | 0.0 /100 | #334 | Tragic 26.9% |
| Yup'ik | 0.0 /100 | #335 | Tragic 27.0% |
| Immigrants | Yemen | 0.0 /100 | #336 | Tragic 27.5% |
| Cheyenne | 0.0 /100 | #337 | Tragic 28.1% |
Demographics Similar to Immigrants from Burma/Myanmar by Female Poverty Among 18-24 Year Olds
In terms of female poverty among 18-24 year olds, the demographic groups most similar to Immigrants from Burma/Myanmar are Celtic (21.6%, a difference of 0.060%), Mongolian (21.6%, a difference of 0.090%), Scotch-Irish (21.6%, a difference of 0.10%), American (21.6%, a difference of 0.15%), and Alaska Native (21.5%, a difference of 0.23%).
| Demographics | Rating | Rank | Female Poverty Among 18-24 Year Olds |
| Immigrants | Bahamas | 0.5 /100 | #261 | Tragic 21.4% |
| Immigrants | Eastern Africa | 0.4 /100 | #262 | Tragic 21.4% |
| Icelanders | 0.3 /100 | #263 | Tragic 21.5% |
| Hondurans | 0.3 /100 | #264 | Tragic 21.5% |
| Immigrants | Nonimmigrants | 0.3 /100 | #265 | Tragic 21.5% |
| Alaska Natives | 0.3 /100 | #266 | Tragic 21.5% |
| Americans | 0.3 /100 | #267 | Tragic 21.6% |
| Immigrants | Burma/Myanmar | 0.2 /100 | #268 | Tragic 21.6% |
| Celtics | 0.2 /100 | #269 | Tragic 21.6% |
| Mongolians | 0.2 /100 | #270 | Tragic 21.6% |
| Scotch-Irish | 0.2 /100 | #271 | Tragic 21.6% |
| Basques | 0.2 /100 | #272 | Tragic 21.7% |
| New Zealanders | 0.2 /100 | #273 | Tragic 21.7% |
| Immigrants | Honduras | 0.1 /100 | #274 | Tragic 21.8% |
| Immigrants | Bangladesh | 0.1 /100 | #275 | Tragic 21.8% |