Immigrants from Romania vs Immigrants from Eritrea Single Father Households
COMPARE
Immigrants from Romania
Immigrants from Eritrea
Single Father Households
Single Father Households Comparison
Immigrants from Romania
Immigrants from Eritrea
2.1%
SINGLE FATHER HOUSEHOLDS
99.8/ 100
METRIC RATING
69th/ 347
METRIC RANK
2.5%
SINGLE FATHER HOUSEHOLDS
2.0/ 100
METRIC RATING
252nd/ 347
METRIC RANK
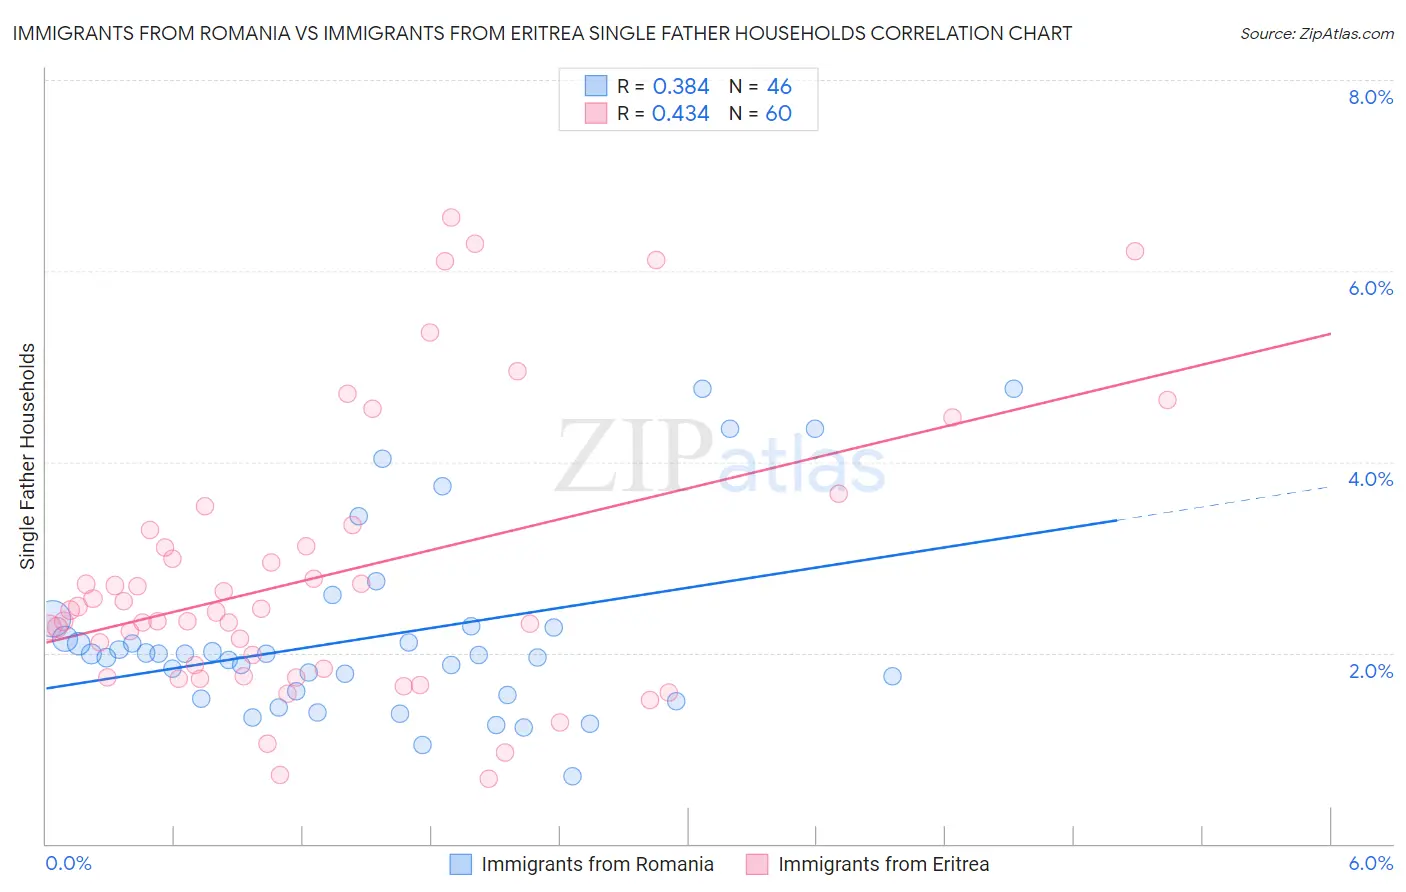
Immigrants from Romania vs Immigrants from Eritrea Single Father Households Correlation Chart
The statistical analysis conducted on geographies consisting of 255,577,760 people shows a mild positive correlation between the proportion of Immigrants from Romania and percentage of single father households in the United States with a correlation coefficient (R) of 0.384 and weighted average of 2.1%. Similarly, the statistical analysis conducted on geographies consisting of 104,791,168 people shows a moderate positive correlation between the proportion of Immigrants from Eritrea and percentage of single father households in the United States with a correlation coefficient (R) of 0.434 and weighted average of 2.5%, a difference of 21.5%.
Single Father Households Correlation Summary
| Measurement | Immigrants from Romania | Immigrants from Eritrea |
| Minimum | 0.71% | 0.67% |
| Maximum | 4.8% | 6.6% |
| Range | 4.1% | 5.9% |
| Mean | 2.2% | 2.8% |
| Median | 2.0% | 2.4% |
| Interquartile 25% (IQ1) | 1.6% | 1.8% |
| Interquartile 75% (IQ3) | 2.3% | 3.2% |
| Interquartile Range (IQR) | 0.71% | 1.4% |
| Standard Deviation (Sample) | 0.97% | 1.4% |
| Standard Deviation (Population) | 0.96% | 1.4% |
Similar Demographics by Single Father Households
Demographics Similar to Immigrants from Romania by Single Father Households
In terms of single father households, the demographic groups most similar to Immigrants from Romania are Immigrants from Denmark (2.1%, a difference of 0.020%), Immigrants from Italy (2.1%, a difference of 0.11%), Immigrants from Western Asia (2.1%, a difference of 0.16%), Egyptian (2.1%, a difference of 0.21%), and Immigrants from Kuwait (2.1%, a difference of 0.22%).
| Demographics | Rating | Rank | Single Father Households |
| Immigrants | Malaysia | 99.9 /100 | #62 | Exceptional 2.0% |
| Maltese | 99.9 /100 | #63 | Exceptional 2.0% |
| Mongolians | 99.9 /100 | #64 | Exceptional 2.1% |
| Paraguayans | 99.9 /100 | #65 | Exceptional 2.1% |
| Immigrants | Western Asia | 99.8 /100 | #66 | Exceptional 2.1% |
| Immigrants | Italy | 99.8 /100 | #67 | Exceptional 2.1% |
| Immigrants | Denmark | 99.8 /100 | #68 | Exceptional 2.1% |
| Immigrants | Romania | 99.8 /100 | #69 | Exceptional 2.1% |
| Egyptians | 99.8 /100 | #70 | Exceptional 2.1% |
| Immigrants | Kuwait | 99.8 /100 | #71 | Exceptional 2.1% |
| Immigrants | Spain | 99.8 /100 | #72 | Exceptional 2.1% |
| Immigrants | Bangladesh | 99.8 /100 | #73 | Exceptional 2.1% |
| Immigrants | Egypt | 99.8 /100 | #74 | Exceptional 2.1% |
| Immigrants | Sweden | 99.8 /100 | #75 | Exceptional 2.1% |
| Immigrants | Scotland | 99.8 /100 | #76 | Exceptional 2.1% |
Demographics Similar to Immigrants from Eritrea by Single Father Households
In terms of single father households, the demographic groups most similar to Immigrants from Eritrea are Liberian (2.5%, a difference of 0.020%), Immigrants from Somalia (2.5%, a difference of 0.070%), Immigrants from Thailand (2.5%, a difference of 0.10%), Somali (2.5%, a difference of 0.11%), and Immigrants from Cameroon (2.5%, a difference of 0.28%).
| Demographics | Rating | Rank | Single Father Households |
| Basques | 2.5 /100 | #245 | Tragic 2.5% |
| Native Hawaiians | 2.5 /100 | #246 | Tragic 2.5% |
| Delaware | 2.5 /100 | #247 | Tragic 2.5% |
| Bahamians | 2.4 /100 | #248 | Tragic 2.5% |
| Immigrants | Cameroon | 2.3 /100 | #249 | Tragic 2.5% |
| Somalis | 2.1 /100 | #250 | Tragic 2.5% |
| Liberians | 2.0 /100 | #251 | Tragic 2.5% |
| Immigrants | Eritrea | 2.0 /100 | #252 | Tragic 2.5% |
| Immigrants | Somalia | 1.9 /100 | #253 | Tragic 2.5% |
| Immigrants | Thailand | 1.8 /100 | #254 | Tragic 2.5% |
| Tongans | 1.5 /100 | #255 | Tragic 2.5% |
| Potawatomi | 1.4 /100 | #256 | Tragic 2.5% |
| Immigrants | Congo | 1.2 /100 | #257 | Tragic 2.5% |
| Spanish | 1.1 /100 | #258 | Tragic 2.5% |
| Comanche | 1.0 /100 | #259 | Tragic 2.5% |