Immigrants from Panama vs Slovene Births to Unmarried Women
COMPARE
Immigrants from Panama
Slovene
Births to Unmarried Women
Births to Unmarried Women Comparison
Immigrants from Panama
Slovenes
34.2%
BIRTHS TO UNMARRIED WOMEN
3.3/ 100
METRIC RATING
227th/ 347
METRIC RANK
31.2%
BIRTHS TO UNMARRIED WOMEN
65.9/ 100
METRIC RATING
162nd/ 347
METRIC RANK
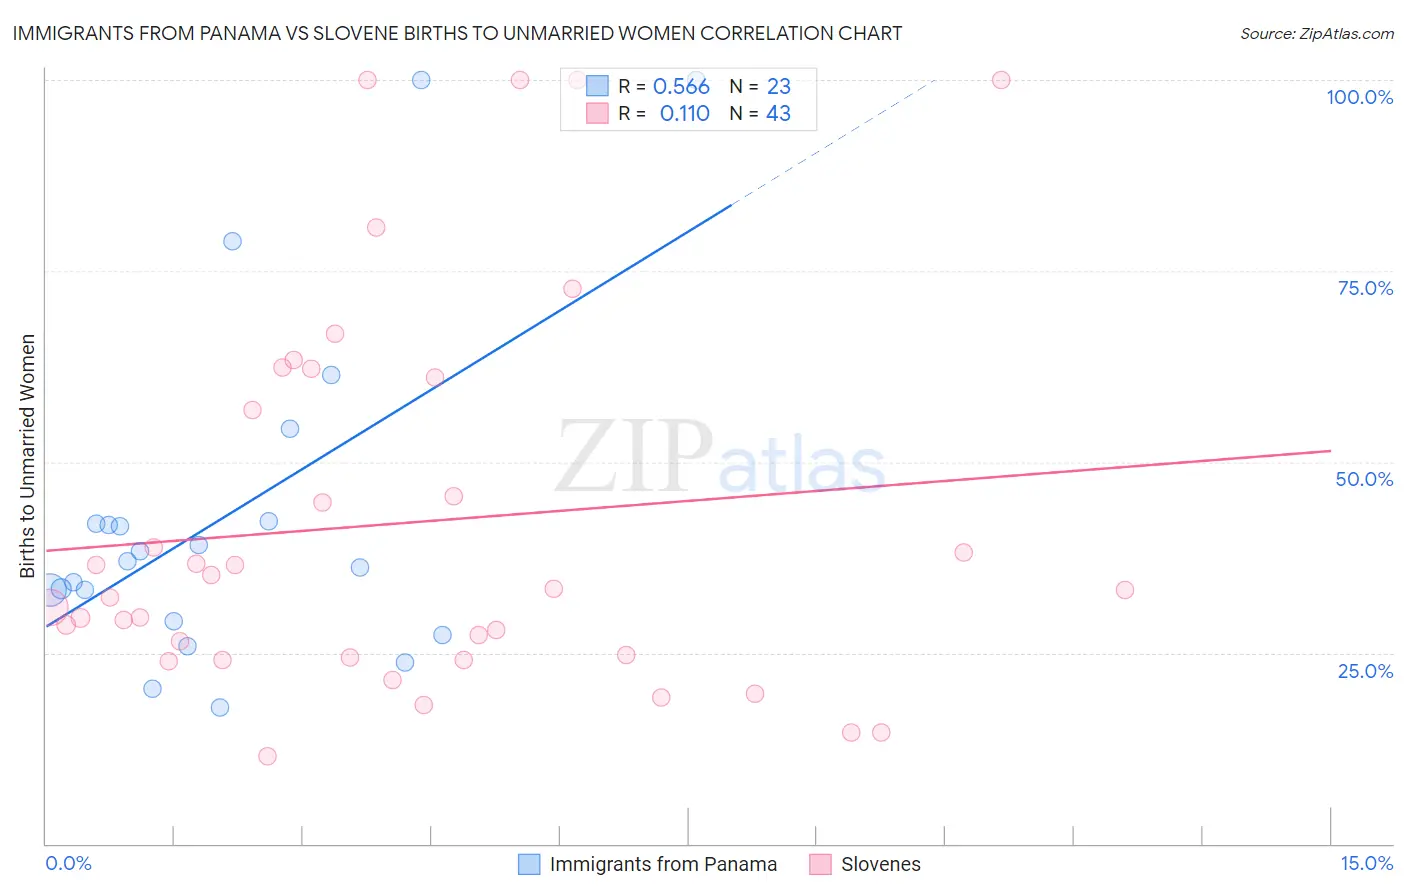
Immigrants from Panama vs Slovene Births to Unmarried Women Correlation Chart
The statistical analysis conducted on geographies consisting of 213,926,652 people shows a substantial positive correlation between the proportion of Immigrants from Panama and percentage of births to unmarried women in the United States with a correlation coefficient (R) of 0.566 and weighted average of 34.2%. Similarly, the statistical analysis conducted on geographies consisting of 244,653,742 people shows a poor positive correlation between the proportion of Slovenes and percentage of births to unmarried women in the United States with a correlation coefficient (R) of 0.110 and weighted average of 31.2%, a difference of 9.7%.
Births to Unmarried Women Correlation Summary
| Measurement | Immigrants from Panama | Slovene |
| Minimum | 17.8% | 11.4% |
| Maximum | 100.0% | 100.0% |
| Range | 82.2% | 88.6% |
| Mean | 43.1% | 42.0% |
| Median | 36.9% | 33.3% |
| Interquartile 25% (IQ1) | 29.1% | 24.4% |
| Interquartile 75% (IQ3) | 42.2% | 61.0% |
| Interquartile Range (IQR) | 13.1% | 36.7% |
| Standard Deviation (Sample) | 22.4% | 25.0% |
| Standard Deviation (Population) | 21.9% | 24.7% |
Similar Demographics by Births to Unmarried Women
Demographics Similar to Immigrants from Panama by Births to Unmarried Women
In terms of births to unmarried women, the demographic groups most similar to Immigrants from Panama are Delaware (34.2%, a difference of 0.010%), Panamanian (34.2%, a difference of 0.030%), Immigrants from Sierra Leone (34.2%, a difference of 0.14%), Ghanaian (34.3%, a difference of 0.17%), and Native Hawaiian (34.3%, a difference of 0.31%).
| Demographics | Rating | Rank | Births to Unmarried Women |
| Portuguese | 5.4 /100 | #220 | Tragic 33.8% |
| Malaysians | 5.0 /100 | #221 | Tragic 33.9% |
| Immigrants | Uruguay | 4.8 /100 | #222 | Tragic 33.9% |
| Pennsylvania Germans | 4.3 /100 | #223 | Tragic 34.0% |
| Immigrants | Laos | 4.3 /100 | #224 | Tragic 34.0% |
| Spanish | 4.0 /100 | #225 | Tragic 34.1% |
| Delaware | 3.3 /100 | #226 | Tragic 34.2% |
| Immigrants | Panama | 3.3 /100 | #227 | Tragic 34.2% |
| Panamanians | 3.3 /100 | #228 | Tragic 34.2% |
| Immigrants | Sierra Leone | 3.1 /100 | #229 | Tragic 34.2% |
| Ghanaians | 3.1 /100 | #230 | Tragic 34.3% |
| Native Hawaiians | 2.9 /100 | #231 | Tragic 34.3% |
| French Canadians | 2.5 /100 | #232 | Tragic 34.4% |
| Bangladeshis | 2.5 /100 | #233 | Tragic 34.4% |
| Immigrants | Zaire | 2.3 /100 | #234 | Tragic 34.5% |
Demographics Similar to Slovenes by Births to Unmarried Women
In terms of births to unmarried women, the demographic groups most similar to Slovenes are Immigrants from Chile (31.2%, a difference of 0.020%), Hungarian (31.2%, a difference of 0.19%), Immigrants from Southern Europe (31.1%, a difference of 0.31%), Immigrants from England (31.1%, a difference of 0.38%), and Immigrants from Western Europe (31.1%, a difference of 0.38%).
| Demographics | Rating | Rank | Births to Unmarried Women |
| Immigrants | Bangladesh | 73.9 /100 | #155 | Good 30.9% |
| Carpatho Rusyns | 73.5 /100 | #156 | Good 30.9% |
| Immigrants | Eastern Africa | 72.1 /100 | #157 | Good 31.0% |
| Austrians | 69.9 /100 | #158 | Good 31.0% |
| Immigrants | England | 69.4 /100 | #159 | Good 31.1% |
| Immigrants | Western Europe | 69.3 /100 | #160 | Good 31.1% |
| Immigrants | Southern Europe | 68.7 /100 | #161 | Good 31.1% |
| Slovenes | 65.9 /100 | #162 | Good 31.2% |
| Immigrants | Chile | 65.7 /100 | #163 | Good 31.2% |
| Hungarians | 64.1 /100 | #164 | Good 31.2% |
| Immigrants | Somalia | 58.1 /100 | #165 | Average 31.4% |
| Peruvians | 55.5 /100 | #166 | Average 31.5% |
| Dutch | 55.3 /100 | #167 | Average 31.5% |
| Belgians | 52.4 /100 | #168 | Average 31.6% |
| Slavs | 52.0 /100 | #169 | Average 31.6% |