Immigrants from Panama vs Immigrants from Caribbean Births to Unmarried Women
COMPARE
Immigrants from Panama
Immigrants from Caribbean
Births to Unmarried Women
Births to Unmarried Women Comparison
Immigrants from Panama
Immigrants from Caribbean
34.2%
BIRTHS TO UNMARRIED WOMEN
3.3/ 100
METRIC RATING
227th/ 347
METRIC RANK
39.8%
BIRTHS TO UNMARRIED WOMEN
0.0/ 100
METRIC RATING
314th/ 347
METRIC RANK
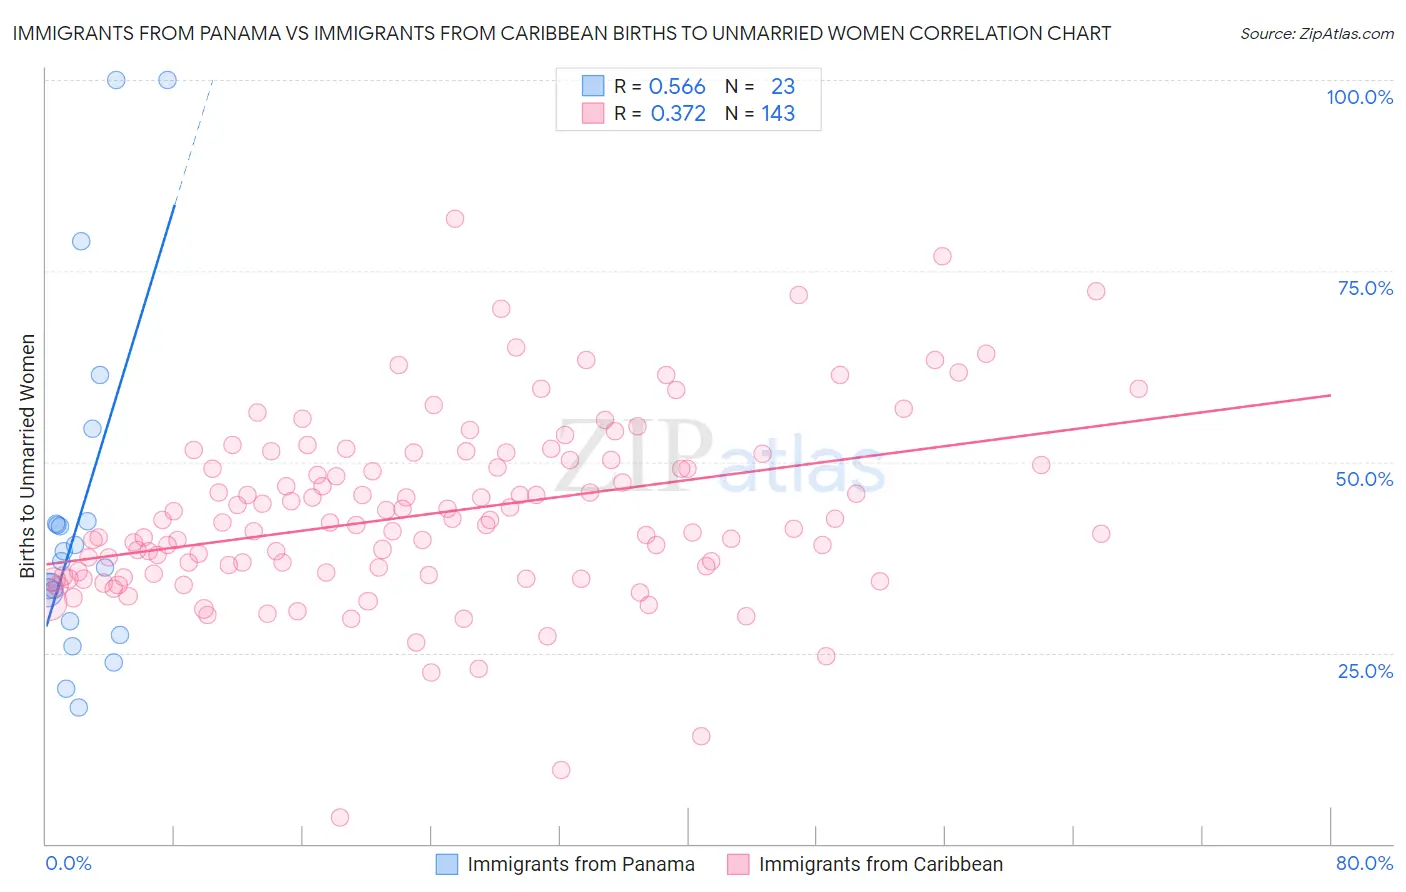
Immigrants from Panama vs Immigrants from Caribbean Births to Unmarried Women Correlation Chart
The statistical analysis conducted on geographies consisting of 213,926,652 people shows a substantial positive correlation between the proportion of Immigrants from Panama and percentage of births to unmarried women in the United States with a correlation coefficient (R) of 0.566 and weighted average of 34.2%. Similarly, the statistical analysis conducted on geographies consisting of 417,835,759 people shows a mild positive correlation between the proportion of Immigrants from Caribbean and percentage of births to unmarried women in the United States with a correlation coefficient (R) of 0.372 and weighted average of 39.8%, a difference of 16.5%.
Births to Unmarried Women Correlation Summary
| Measurement | Immigrants from Panama | Immigrants from Caribbean |
| Minimum | 17.8% | 3.4% |
| Maximum | 100.0% | 81.8% |
| Range | 82.2% | 78.4% |
| Mean | 43.1% | 43.3% |
| Median | 36.9% | 42.0% |
| Interquartile 25% (IQ1) | 29.1% | 35.4% |
| Interquartile 75% (IQ3) | 42.2% | 50.3% |
| Interquartile Range (IQR) | 13.1% | 15.0% |
| Standard Deviation (Sample) | 22.4% | 12.1% |
| Standard Deviation (Population) | 21.9% | 12.0% |
Similar Demographics by Births to Unmarried Women
Demographics Similar to Immigrants from Panama by Births to Unmarried Women
In terms of births to unmarried women, the demographic groups most similar to Immigrants from Panama are Delaware (34.2%, a difference of 0.010%), Panamanian (34.2%, a difference of 0.030%), Immigrants from Sierra Leone (34.2%, a difference of 0.14%), Ghanaian (34.3%, a difference of 0.17%), and Native Hawaiian (34.3%, a difference of 0.31%).
| Demographics | Rating | Rank | Births to Unmarried Women |
| Portuguese | 5.4 /100 | #220 | Tragic 33.8% |
| Malaysians | 5.0 /100 | #221 | Tragic 33.9% |
| Immigrants | Uruguay | 4.8 /100 | #222 | Tragic 33.9% |
| Pennsylvania Germans | 4.3 /100 | #223 | Tragic 34.0% |
| Immigrants | Laos | 4.3 /100 | #224 | Tragic 34.0% |
| Spanish | 4.0 /100 | #225 | Tragic 34.1% |
| Delaware | 3.3 /100 | #226 | Tragic 34.2% |
| Immigrants | Panama | 3.3 /100 | #227 | Tragic 34.2% |
| Panamanians | 3.3 /100 | #228 | Tragic 34.2% |
| Immigrants | Sierra Leone | 3.1 /100 | #229 | Tragic 34.2% |
| Ghanaians | 3.1 /100 | #230 | Tragic 34.3% |
| Native Hawaiians | 2.9 /100 | #231 | Tragic 34.3% |
| French Canadians | 2.5 /100 | #232 | Tragic 34.4% |
| Bangladeshis | 2.5 /100 | #233 | Tragic 34.4% |
| Immigrants | Zaire | 2.3 /100 | #234 | Tragic 34.5% |
Demographics Similar to Immigrants from Caribbean by Births to Unmarried Women
In terms of births to unmarried women, the demographic groups most similar to Immigrants from Caribbean are Dominican (39.8%, a difference of 0.040%), Apache (39.9%, a difference of 0.10%), African (39.7%, a difference of 0.29%), U.S. Virgin Islander (39.6%, a difference of 0.63%), and Immigrants from the Azores (39.6%, a difference of 0.65%).
| Demographics | Rating | Rank | Births to Unmarried Women |
| Immigrants | Honduras | 0.0 /100 | #307 | Tragic 39.3% |
| Aleuts | 0.0 /100 | #308 | Tragic 39.3% |
| Cubans | 0.0 /100 | #309 | Tragic 39.4% |
| Immigrants | Dominica | 0.0 /100 | #310 | Tragic 39.5% |
| Immigrants | Azores | 0.0 /100 | #311 | Tragic 39.6% |
| U.S. Virgin Islanders | 0.0 /100 | #312 | Tragic 39.6% |
| Africans | 0.0 /100 | #313 | Tragic 39.7% |
| Immigrants | Caribbean | 0.0 /100 | #314 | Tragic 39.8% |
| Dominicans | 0.0 /100 | #315 | Tragic 39.8% |
| Apache | 0.0 /100 | #316 | Tragic 39.9% |
| Immigrants | Dominican Republic | 0.0 /100 | #317 | Tragic 40.1% |
| Immigrants | Bahamas | 0.0 /100 | #318 | Tragic 40.1% |
| Yakama | 0.0 /100 | #319 | Tragic 40.3% |
| Crow | 0.0 /100 | #320 | Tragic 40.4% |
| Bahamians | 0.0 /100 | #321 | Tragic 40.8% |