Immigrants from Pakistan vs Immigrants from Honduras Family Households
COMPARE
Immigrants from Pakistan
Immigrants from Honduras
Family Households
Family Households Comparison
Immigrants from Pakistan
Immigrants from Honduras
67.7%
FAMILY HOUSEHOLDS
100.0/ 100
METRIC RATING
23rd/ 347
METRIC RANK
64.2%
FAMILY HOUSEHOLDS
35.0/ 100
METRIC RATING
180th/ 347
METRIC RANK
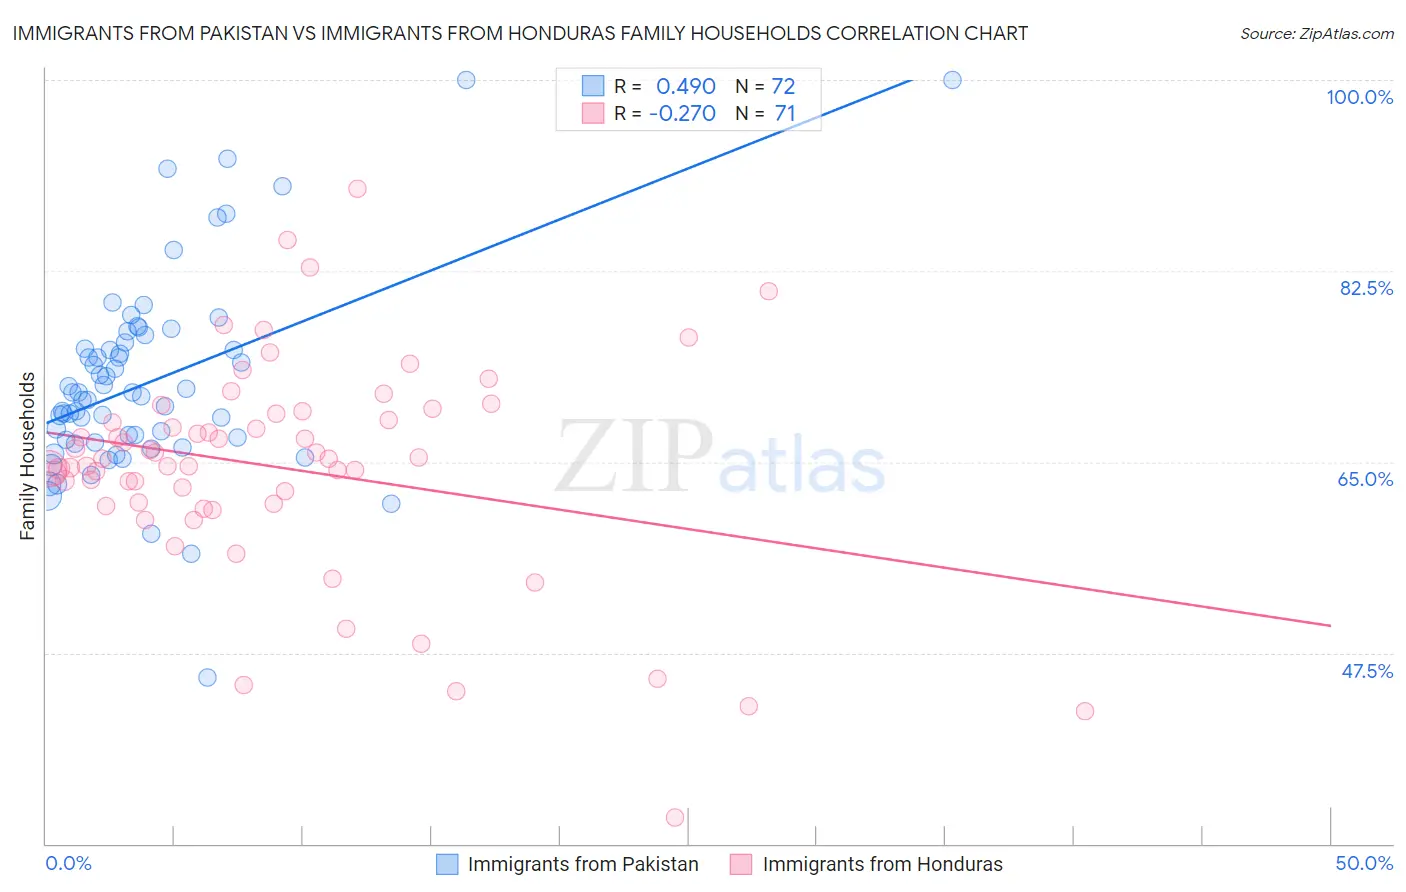
Immigrants from Pakistan vs Immigrants from Honduras Family Households Correlation Chart
The statistical analysis conducted on geographies consisting of 283,802,176 people shows a moderate positive correlation between the proportion of Immigrants from Pakistan and percentage of family households in the United States with a correlation coefficient (R) of 0.490 and weighted average of 67.7%. Similarly, the statistical analysis conducted on geographies consisting of 322,466,893 people shows a weak negative correlation between the proportion of Immigrants from Honduras and percentage of family households in the United States with a correlation coefficient (R) of -0.270 and weighted average of 64.2%, a difference of 5.4%.
Family Households Correlation Summary
| Measurement | Immigrants from Pakistan | Immigrants from Honduras |
| Minimum | 45.3% | 32.4% |
| Maximum | 100.0% | 90.0% |
| Range | 54.7% | 57.7% |
| Mean | 72.3% | 64.5% |
| Median | 71.1% | 65.3% |
| Interquartile 25% (IQ1) | 66.9% | 61.2% |
| Interquartile 75% (IQ3) | 75.7% | 69.4% |
| Interquartile Range (IQR) | 8.8% | 8.2% |
| Standard Deviation (Sample) | 9.1% | 10.0% |
| Standard Deviation (Population) | 9.1% | 9.9% |
Similar Demographics by Family Households
Demographics Similar to Immigrants from Pakistan by Family Households
In terms of family households, the demographic groups most similar to Immigrants from Pakistan are Sri Lankan (67.7%, a difference of 0.090%), Cuban (67.7%, a difference of 0.12%), Inupiat (67.8%, a difference of 0.17%), Immigrants from South Eastern Asia (67.5%, a difference of 0.28%), and Immigrants from Nicaragua (67.5%, a difference of 0.31%).
| Demographics | Rating | Rank | Family Households |
| Immigrants | Vietnam | 100.0 /100 | #16 | Exceptional 68.2% |
| Chinese | 100.0 /100 | #17 | Exceptional 68.1% |
| Immigrants | Taiwan | 100.0 /100 | #18 | Exceptional 68.0% |
| Samoans | 100.0 /100 | #19 | Exceptional 67.9% |
| Inupiat | 100.0 /100 | #20 | Exceptional 67.8% |
| Cubans | 100.0 /100 | #21 | Exceptional 67.7% |
| Sri Lankans | 100.0 /100 | #22 | Exceptional 67.7% |
| Immigrants | Pakistan | 100.0 /100 | #23 | Exceptional 67.7% |
| Immigrants | South Eastern Asia | 100.0 /100 | #24 | Exceptional 67.5% |
| Immigrants | Nicaragua | 100.0 /100 | #25 | Exceptional 67.5% |
| Immigrants | India | 100.0 /100 | #26 | Exceptional 67.4% |
| Hispanics or Latinos | 100.0 /100 | #27 | Exceptional 67.4% |
| Hawaiians | 100.0 /100 | #28 | Exceptional 67.4% |
| Nicaraguans | 100.0 /100 | #29 | Exceptional 67.4% |
| Immigrants | Peru | 100.0 /100 | #30 | Exceptional 67.2% |
Demographics Similar to Immigrants from Honduras by Family Households
In terms of family households, the demographic groups most similar to Immigrants from Honduras are Immigrants from Trinidad and Tobago (64.2%, a difference of 0.0%), Ukrainian (64.2%, a difference of 0.0%), Creek (64.2%, a difference of 0.010%), Puerto Rican (64.2%, a difference of 0.020%), and Immigrants from Ukraine (64.2%, a difference of 0.050%).
| Demographics | Rating | Rank | Family Households |
| Immigrants | Sierra Leone | 52.5 /100 | #173 | Average 64.3% |
| Immigrants | Germany | 50.0 /100 | #174 | Average 64.3% |
| Bangladeshis | 44.3 /100 | #175 | Average 64.3% |
| Vietnamese | 43.6 /100 | #176 | Average 64.2% |
| Immigrants | Micronesia | 42.3 /100 | #177 | Average 64.2% |
| Jamaicans | 40.6 /100 | #178 | Average 64.2% |
| Immigrants | Ukraine | 38.2 /100 | #179 | Fair 64.2% |
| Immigrants | Honduras | 35.0 /100 | #180 | Fair 64.2% |
| Immigrants | Trinidad and Tobago | 34.9 /100 | #181 | Fair 64.2% |
| Ukrainians | 34.6 /100 | #182 | Fair 64.2% |
| Creek | 34.1 /100 | #183 | Fair 64.2% |
| Puerto Ricans | 33.4 /100 | #184 | Fair 64.2% |
| Immigrants | Iran | 30.4 /100 | #185 | Fair 64.1% |
| Spanish Americans | 30.1 /100 | #186 | Fair 64.1% |
| Northern Europeans | 28.2 /100 | #187 | Fair 64.1% |