Iraqi vs Immigrants from Jamaica Family Households
COMPARE
Iraqi
Immigrants from Jamaica
Family Households
Family Households Comparison
Iraqis
Immigrants from Jamaica
64.4%
FAMILY HOUSEHOLDS
56.0/ 100
METRIC RATING
169th/ 347
METRIC RANK
64.7%
FAMILY HOUSEHOLDS
85.3/ 100
METRIC RATING
139th/ 347
METRIC RANK
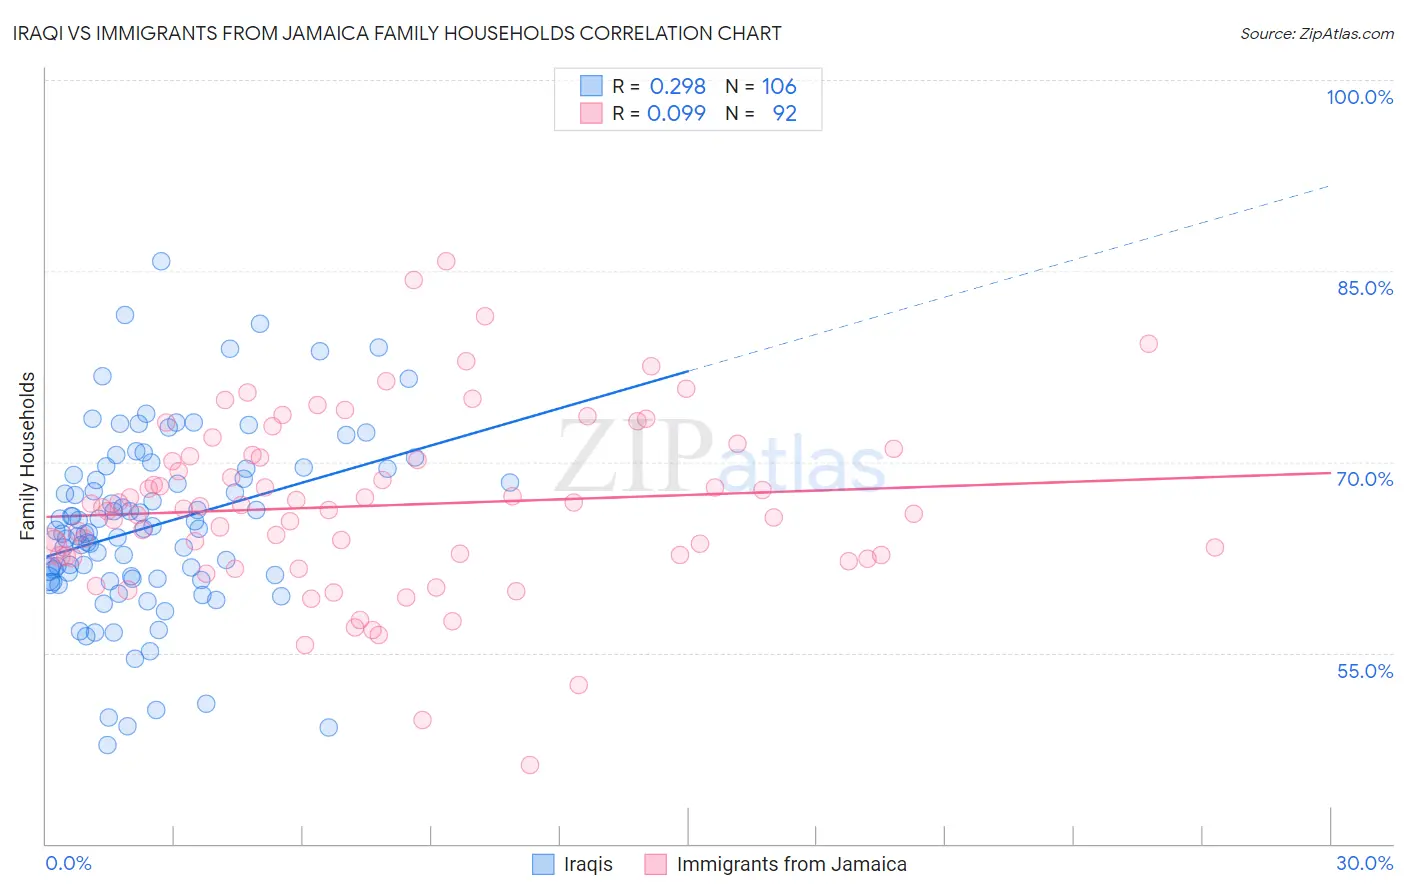
Iraqi vs Immigrants from Jamaica Family Households Correlation Chart
The statistical analysis conducted on geographies consisting of 170,639,485 people shows a weak positive correlation between the proportion of Iraqis and percentage of family households in the United States with a correlation coefficient (R) of 0.298 and weighted average of 64.4%. Similarly, the statistical analysis conducted on geographies consisting of 301,592,909 people shows a slight positive correlation between the proportion of Immigrants from Jamaica and percentage of family households in the United States with a correlation coefficient (R) of 0.099 and weighted average of 64.7%, a difference of 0.51%.
Family Households Correlation Summary
| Measurement | Iraqi | Immigrants from Jamaica |
| Minimum | 47.7% | 46.2% |
| Maximum | 85.7% | 85.7% |
| Range | 38.0% | 39.5% |
| Mean | 65.0% | 66.6% |
| Median | 64.7% | 66.4% |
| Interquartile 25% (IQ1) | 60.8% | 62.6% |
| Interquartile 75% (IQ3) | 69.4% | 70.5% |
| Interquartile Range (IQR) | 8.6% | 7.9% |
| Standard Deviation (Sample) | 7.1% | 6.9% |
| Standard Deviation (Population) | 7.1% | 6.9% |
Similar Demographics by Family Households
Demographics Similar to Iraqis by Family Households
In terms of family households, the demographic groups most similar to Iraqis are Armenian (64.4%, a difference of 0.0%), Honduran (64.4%, a difference of 0.020%), Ute (64.3%, a difference of 0.020%), Irish (64.4%, a difference of 0.030%), and Dutch West Indian (64.3%, a difference of 0.030%).
| Demographics | Rating | Rank | Family Households |
| British | 61.6 /100 | #162 | Good 64.4% |
| Chickasaw | 61.5 /100 | #163 | Good 64.4% |
| Immigrants | Nigeria | 60.1 /100 | #164 | Good 64.4% |
| Immigrants | Southern Europe | 60.0 /100 | #165 | Good 64.4% |
| Scotch-Irish | 59.2 /100 | #166 | Average 64.4% |
| Irish | 57.9 /100 | #167 | Average 64.4% |
| Hondurans | 57.5 /100 | #168 | Average 64.4% |
| Iraqis | 56.0 /100 | #169 | Average 64.4% |
| Armenians | 55.9 /100 | #170 | Average 64.4% |
| Ute | 54.6 /100 | #171 | Average 64.3% |
| Dutch West Indians | 53.9 /100 | #172 | Average 64.3% |
| Immigrants | Sierra Leone | 52.5 /100 | #173 | Average 64.3% |
| Immigrants | Germany | 50.0 /100 | #174 | Average 64.3% |
| Bangladeshis | 44.3 /100 | #175 | Average 64.3% |
| Vietnamese | 43.6 /100 | #176 | Average 64.2% |
Demographics Similar to Immigrants from Jamaica by Family Households
In terms of family households, the demographic groups most similar to Immigrants from Jamaica are Basque (64.7%, a difference of 0.010%), Immigrants from North Macedonia (64.7%, a difference of 0.010%), Immigrants from Cameroon (64.7%, a difference of 0.010%), Immigrants from China (64.7%, a difference of 0.030%), and Immigrants from Scotland (64.7%, a difference of 0.030%).
| Demographics | Rating | Rank | Family Households |
| Cajuns | 89.4 /100 | #132 | Excellent 64.8% |
| Belizeans | 89.3 /100 | #133 | Excellent 64.8% |
| Greeks | 88.1 /100 | #134 | Excellent 64.7% |
| Maltese | 87.4 /100 | #135 | Excellent 64.7% |
| Immigrants | China | 86.6 /100 | #136 | Excellent 64.7% |
| Immigrants | Scotland | 86.4 /100 | #137 | Excellent 64.7% |
| Basques | 85.5 /100 | #138 | Excellent 64.7% |
| Immigrants | Jamaica | 85.3 /100 | #139 | Excellent 64.7% |
| Immigrants | North Macedonia | 84.9 /100 | #140 | Excellent 64.7% |
| Immigrants | Cameroon | 84.8 /100 | #141 | Excellent 64.7% |
| Pakistanis | 84.0 /100 | #142 | Excellent 64.7% |
| Czechoslovakians | 82.1 /100 | #143 | Excellent 64.6% |
| South American Indians | 81.9 /100 | #144 | Excellent 64.6% |
| Welsh | 80.1 /100 | #145 | Excellent 64.6% |
| Immigrants | Romania | 77.0 /100 | #146 | Good 64.6% |