Immigrants from Norway vs Immigrants from Nicaragua Single Mother Households
COMPARE
Immigrants from Norway
Immigrants from Nicaragua
Single Mother Households
Single Mother Households Comparison
Immigrants from Norway
Immigrants from Nicaragua
5.6%
SINGLE MOTHER HOUSEHOLDS
98.7/ 100
METRIC RATING
60th/ 347
METRIC RANK
7.4%
SINGLE MOTHER HOUSEHOLDS
0.2/ 100
METRIC RATING
263rd/ 347
METRIC RANK
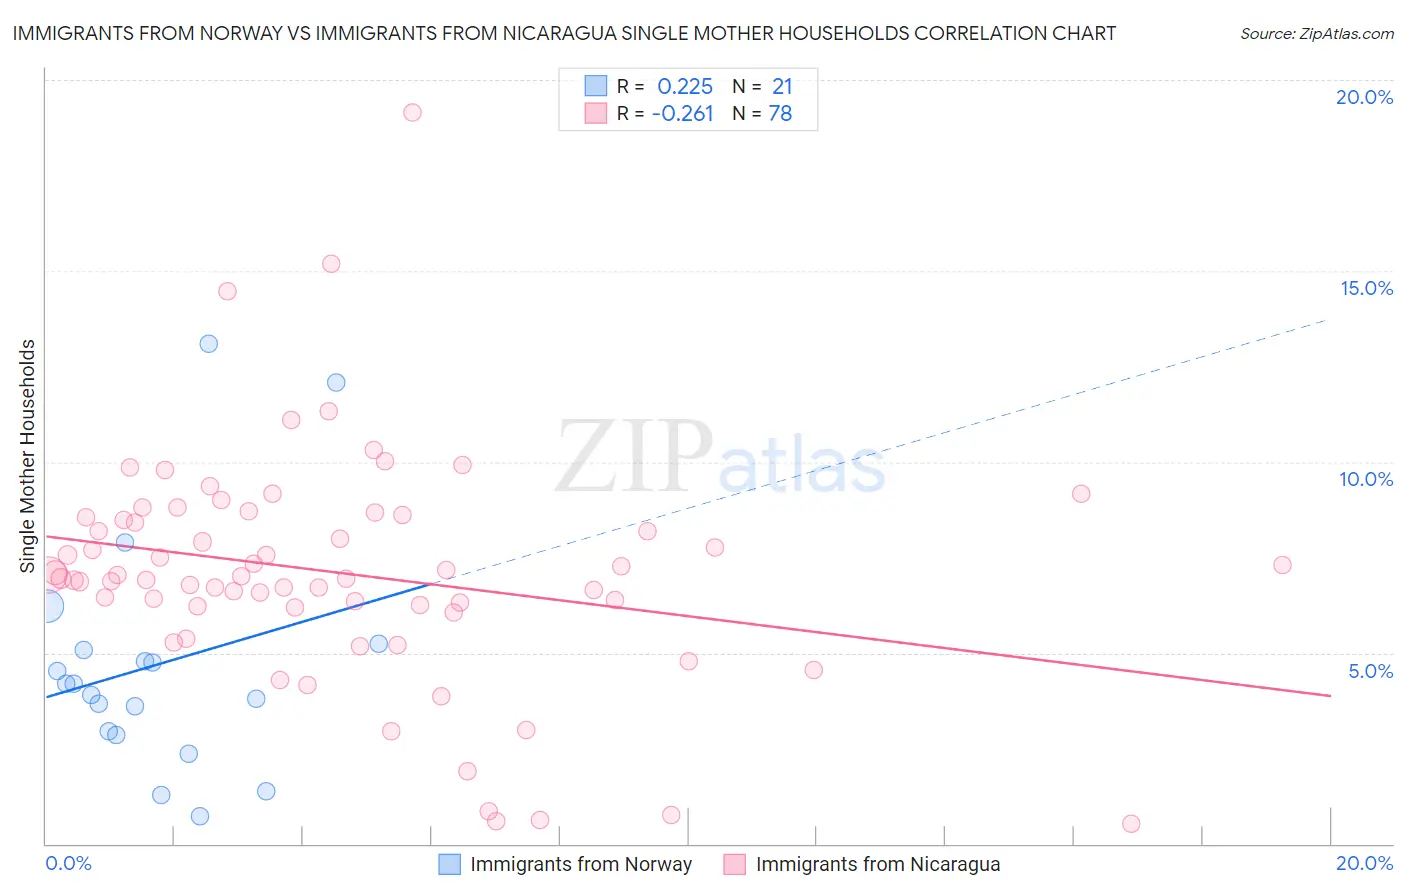
Immigrants from Norway vs Immigrants from Nicaragua Single Mother Households Correlation Chart
The statistical analysis conducted on geographies consisting of 116,559,086 people shows a weak positive correlation between the proportion of Immigrants from Norway and percentage of single mother households in the United States with a correlation coefficient (R) of 0.225 and weighted average of 5.6%. Similarly, the statistical analysis conducted on geographies consisting of 236,236,713 people shows a weak negative correlation between the proportion of Immigrants from Nicaragua and percentage of single mother households in the United States with a correlation coefficient (R) of -0.261 and weighted average of 7.4%, a difference of 33.5%.
Single Mother Households Correlation Summary
| Measurement | Immigrants from Norway | Immigrants from Nicaragua |
| Minimum | 0.71% | 0.51% |
| Maximum | 13.1% | 19.1% |
| Range | 12.4% | 18.6% |
| Mean | 4.7% | 7.1% |
| Median | 4.2% | 7.0% |
| Interquartile 25% (IQ1) | 2.9% | 6.2% |
| Interquartile 75% (IQ3) | 5.2% | 8.5% |
| Interquartile Range (IQR) | 2.3% | 2.3% |
| Standard Deviation (Sample) | 3.1% | 3.0% |
| Standard Deviation (Population) | 3.0% | 3.0% |
Similar Demographics by Single Mother Households
Demographics Similar to Immigrants from Norway by Single Mother Households
In terms of single mother households, the demographic groups most similar to Immigrants from Norway are Australian (5.6%, a difference of 0.070%), Polish (5.6%, a difference of 0.080%), Luxembourger (5.6%, a difference of 0.15%), Immigrants from North Macedonia (5.6%, a difference of 0.15%), and Immigrants from France (5.6%, a difference of 0.18%).
| Demographics | Rating | Rank | Single Mother Households |
| Immigrants | Russia | 99.1 /100 | #53 | Exceptional 5.5% |
| Immigrants | Lebanon | 99.1 /100 | #54 | Exceptional 5.5% |
| Immigrants | Denmark | 99.1 /100 | #55 | Exceptional 5.5% |
| Immigrants | Romania | 99.0 /100 | #56 | Exceptional 5.5% |
| Immigrants | Europe | 99.0 /100 | #57 | Exceptional 5.5% |
| Danes | 98.9 /100 | #58 | Exceptional 5.5% |
| Luxembourgers | 98.7 /100 | #59 | Exceptional 5.6% |
| Immigrants | Norway | 98.7 /100 | #60 | Exceptional 5.6% |
| Australians | 98.7 /100 | #61 | Exceptional 5.6% |
| Poles | 98.6 /100 | #62 | Exceptional 5.6% |
| Immigrants | North Macedonia | 98.6 /100 | #63 | Exceptional 5.6% |
| Immigrants | France | 98.6 /100 | #64 | Exceptional 5.6% |
| Greeks | 98.6 /100 | #65 | Exceptional 5.6% |
| Immigrants | Canada | 98.5 /100 | #66 | Exceptional 5.6% |
| Italians | 98.5 /100 | #67 | Exceptional 5.6% |
Demographics Similar to Immigrants from Nicaragua by Single Mother Households
In terms of single mother households, the demographic groups most similar to Immigrants from Nicaragua are Yaqui (7.4%, a difference of 0.080%), Immigrants from Somalia (7.4%, a difference of 0.15%), Crow (7.4%, a difference of 0.25%), Japanese (7.4%, a difference of 0.35%), and Nepalese (7.5%, a difference of 0.35%).
| Demographics | Rating | Rank | Single Mother Households |
| Seminole | 0.2 /100 | #256 | Tragic 7.4% |
| Alaska Natives | 0.2 /100 | #257 | Tragic 7.4% |
| Pueblo | 0.2 /100 | #258 | Tragic 7.4% |
| Immigrants | Yemen | 0.2 /100 | #259 | Tragic 7.4% |
| Immigrants | Zaire | 0.2 /100 | #260 | Tragic 7.4% |
| Japanese | 0.2 /100 | #261 | Tragic 7.4% |
| Immigrants | Somalia | 0.2 /100 | #262 | Tragic 7.4% |
| Immigrants | Nicaragua | 0.2 /100 | #263 | Tragic 7.4% |
| Yaqui | 0.1 /100 | #264 | Tragic 7.4% |
| Crow | 0.1 /100 | #265 | Tragic 7.4% |
| Nepalese | 0.1 /100 | #266 | Tragic 7.5% |
| Blackfeet | 0.1 /100 | #267 | Tragic 7.5% |
| Indonesians | 0.1 /100 | #268 | Tragic 7.5% |
| Somalis | 0.1 /100 | #269 | Tragic 7.5% |
| Immigrants | Cuba | 0.1 /100 | #270 | Tragic 7.5% |