Immigrants from Norway vs Immigrants from Nicaragua 11th Grade
COMPARE
Immigrants from Norway
Immigrants from Nicaragua
11th Grade
11th Grade Comparison
Immigrants from Norway
Immigrants from Nicaragua
93.5%
11TH GRADE
98.4/ 100
METRIC RATING
107th/ 347
METRIC RANK
88.1%
11TH GRADE
0.0/ 100
METRIC RATING
325th/ 347
METRIC RANK
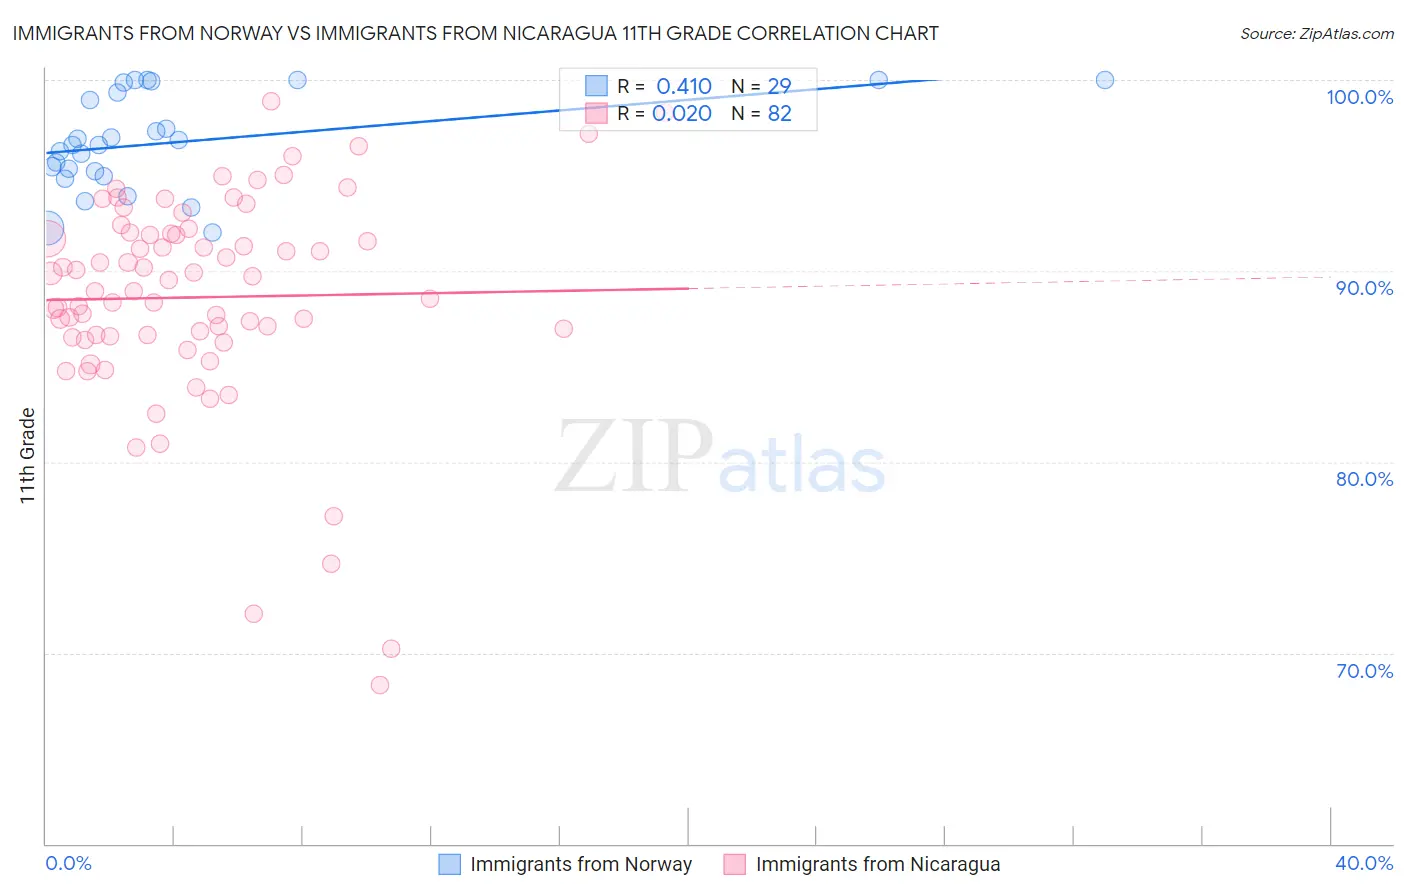
Immigrants from Norway vs Immigrants from Nicaragua 11th Grade Correlation Chart
The statistical analysis conducted on geographies consisting of 116,716,420 people shows a moderate positive correlation between the proportion of Immigrants from Norway and percentage of population with at least 11th grade education in the United States with a correlation coefficient (R) of 0.410 and weighted average of 93.5%. Similarly, the statistical analysis conducted on geographies consisting of 236,340,506 people shows no correlation between the proportion of Immigrants from Nicaragua and percentage of population with at least 11th grade education in the United States with a correlation coefficient (R) of 0.020 and weighted average of 88.1%, a difference of 6.0%.
11th Grade Correlation Summary
| Measurement | Immigrants from Norway | Immigrants from Nicaragua |
| Minimum | 92.0% | 68.3% |
| Maximum | 100.0% | 98.9% |
| Range | 8.0% | 30.6% |
| Mean | 96.8% | 88.6% |
| Median | 96.6% | 89.2% |
| Interquartile 25% (IQ1) | 95.1% | 86.6% |
| Interquartile 75% (IQ3) | 99.6% | 92.0% |
| Interquartile Range (IQR) | 4.5% | 5.4% |
| Standard Deviation (Sample) | 2.5% | 5.7% |
| Standard Deviation (Population) | 2.4% | 5.6% |
Similar Demographics by 11th Grade
Demographics Similar to Immigrants from Norway by 11th Grade
In terms of 11th grade, the demographic groups most similar to Immigrants from Norway are Alaska Native (93.5%, a difference of 0.0%), Immigrants from Kuwait (93.5%, a difference of 0.010%), Syrian (93.4%, a difference of 0.010%), Lebanese (93.5%, a difference of 0.020%), and Immigrants from Europe (93.5%, a difference of 0.020%).
| Demographics | Rating | Rank | 11th Grade |
| Immigrants | North Macedonia | 98.7 /100 | #100 | Exceptional 93.5% |
| Immigrants | Romania | 98.7 /100 | #101 | Exceptional 93.5% |
| Chippewa | 98.6 /100 | #102 | Exceptional 93.5% |
| Lebanese | 98.6 /100 | #103 | Exceptional 93.5% |
| Immigrants | Europe | 98.6 /100 | #104 | Exceptional 93.5% |
| Immigrants | Serbia | 98.6 /100 | #105 | Exceptional 93.5% |
| Immigrants | Croatia | 98.6 /100 | #106 | Exceptional 93.5% |
| Immigrants | Norway | 98.4 /100 | #107 | Exceptional 93.5% |
| Alaska Natives | 98.4 /100 | #108 | Exceptional 93.5% |
| Immigrants | Kuwait | 98.4 /100 | #109 | Exceptional 93.5% |
| Syrians | 98.4 /100 | #110 | Exceptional 93.4% |
| Yugoslavians | 98.1 /100 | #111 | Exceptional 93.4% |
| Immigrants | Germany | 98.0 /100 | #112 | Exceptional 93.4% |
| Immigrants | Zimbabwe | 97.8 /100 | #113 | Exceptional 93.4% |
| Jordanians | 97.8 /100 | #114 | Exceptional 93.4% |
Demographics Similar to Immigrants from Nicaragua by 11th Grade
In terms of 11th grade, the demographic groups most similar to Immigrants from Nicaragua are Central American Indian (88.2%, a difference of 0.13%), Pima (88.3%, a difference of 0.17%), Puerto Rican (88.4%, a difference of 0.25%), Dominican (87.7%, a difference of 0.54%), and Immigrants from Cabo Verde (87.6%, a difference of 0.57%).
| Demographics | Rating | Rank | 11th Grade |
| Nicaraguans | 0.0 /100 | #318 | Tragic 88.9% |
| Belizeans | 0.0 /100 | #319 | Tragic 88.8% |
| Immigrants | Armenia | 0.0 /100 | #320 | Tragic 88.8% |
| Immigrants | Belize | 0.0 /100 | #321 | Tragic 88.7% |
| Puerto Ricans | 0.0 /100 | #322 | Tragic 88.4% |
| Pima | 0.0 /100 | #323 | Tragic 88.3% |
| Central American Indians | 0.0 /100 | #324 | Tragic 88.2% |
| Immigrants | Nicaragua | 0.0 /100 | #325 | Tragic 88.1% |
| Dominicans | 0.0 /100 | #326 | Tragic 87.7% |
| Immigrants | Cabo Verde | 0.0 /100 | #327 | Tragic 87.6% |
| Tohono O'odham | 0.0 /100 | #328 | Tragic 87.6% |
| Mexican American Indians | 0.0 /100 | #329 | Tragic 87.5% |
| Hondurans | 0.0 /100 | #330 | Tragic 87.4% |
| Hispanics or Latinos | 0.0 /100 | #331 | Tragic 87.3% |
| Immigrants | Azores | 0.0 /100 | #332 | Tragic 87.2% |