Immigrants from the Azores vs Immigrants from Nicaragua Single Mother Households
COMPARE
Immigrants from the Azores
Immigrants from Nicaragua
Single Mother Households
Single Mother Households Comparison
Immigrants from the Azores
Immigrants from Nicaragua
7.5%
SINGLE MOTHER HOUSEHOLDS
0.1/ 100
METRIC RATING
272nd/ 347
METRIC RANK
7.4%
SINGLE MOTHER HOUSEHOLDS
0.2/ 100
METRIC RATING
263rd/ 347
METRIC RANK
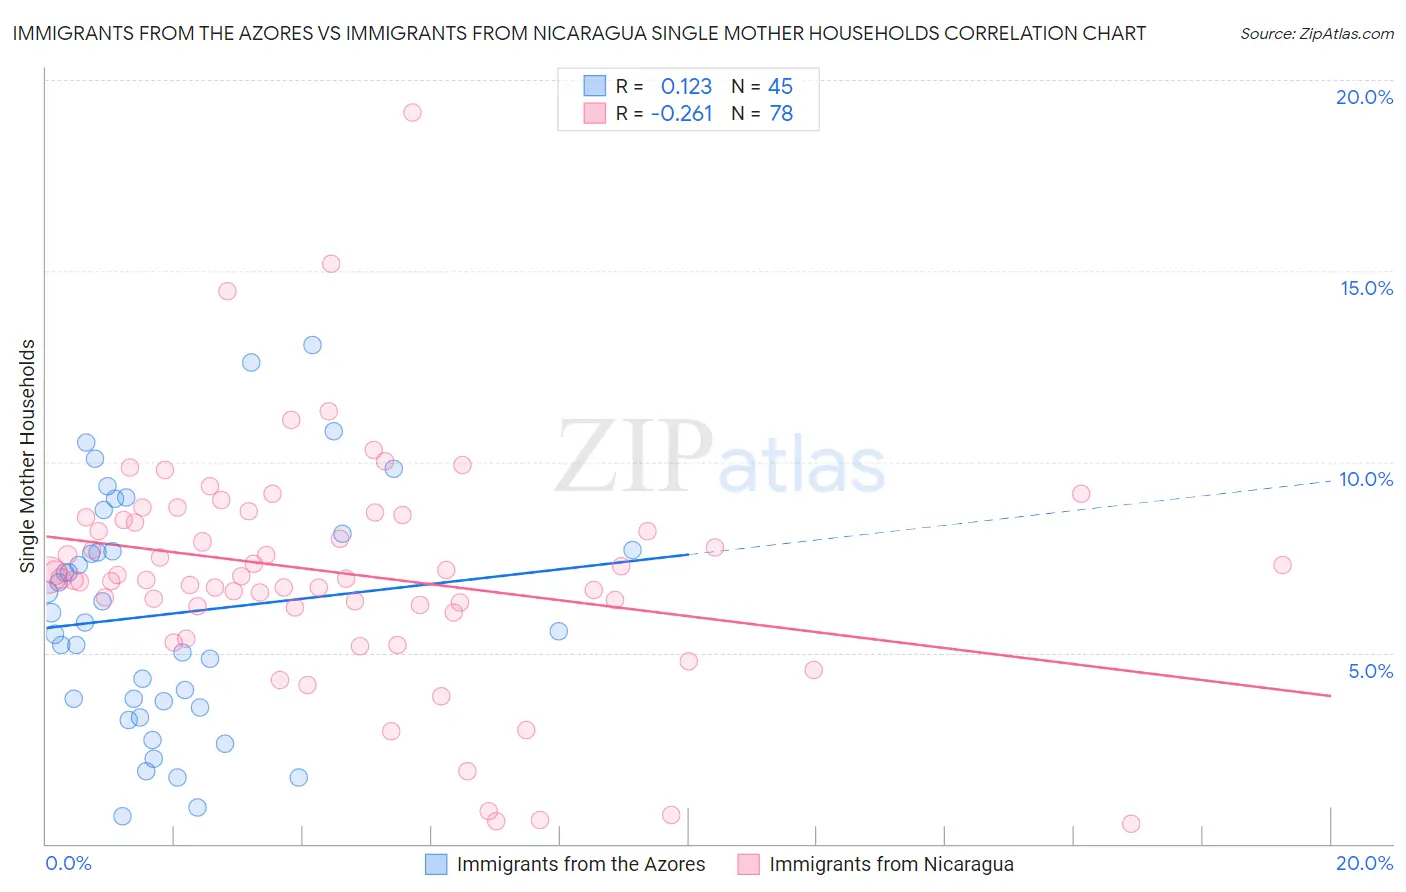
Immigrants from the Azores vs Immigrants from Nicaragua Single Mother Households Correlation Chart
The statistical analysis conducted on geographies consisting of 46,218,711 people shows a poor positive correlation between the proportion of Immigrants from the Azores and percentage of single mother households in the United States with a correlation coefficient (R) of 0.123 and weighted average of 7.5%. Similarly, the statistical analysis conducted on geographies consisting of 236,236,713 people shows a weak negative correlation between the proportion of Immigrants from Nicaragua and percentage of single mother households in the United States with a correlation coefficient (R) of -0.261 and weighted average of 7.4%, a difference of 1.4%.
Single Mother Households Correlation Summary
| Measurement | Immigrants from the Azores | Immigrants from Nicaragua |
| Minimum | 0.74% | 0.51% |
| Maximum | 13.1% | 19.1% |
| Range | 12.3% | 18.6% |
| Mean | 6.0% | 7.1% |
| Median | 5.8% | 7.0% |
| Interquartile 25% (IQ1) | 3.6% | 6.2% |
| Interquartile 75% (IQ3) | 7.9% | 8.5% |
| Interquartile Range (IQR) | 4.3% | 2.3% |
| Standard Deviation (Sample) | 3.1% | 3.0% |
| Standard Deviation (Population) | 3.0% | 3.0% |
Demographics Similar to Immigrants from the Azores and Immigrants from Nicaragua by Single Mother Households
In terms of single mother households, the demographic groups most similar to Immigrants from the Azores are Salvadoran (7.5%, a difference of 0.0%), Immigrants from Cuba (7.5%, a difference of 0.090%), Somali (7.5%, a difference of 0.25%), Belizean (7.6%, a difference of 0.31%), and Immigrants from Guyana (7.6%, a difference of 0.36%). Similarly, the demographic groups most similar to Immigrants from Nicaragua are Yaqui (7.4%, a difference of 0.080%), Immigrants from Somalia (7.4%, a difference of 0.15%), Crow (7.4%, a difference of 0.25%), Japanese (7.4%, a difference of 0.35%), and Nepalese (7.5%, a difference of 0.35%).
| Demographics | Rating | Rank | Single Mother Households |
| Alaska Natives | 0.2 /100 | #257 | Tragic 7.4% |
| Pueblo | 0.2 /100 | #258 | Tragic 7.4% |
| Immigrants | Yemen | 0.2 /100 | #259 | Tragic 7.4% |
| Immigrants | Zaire | 0.2 /100 | #260 | Tragic 7.4% |
| Japanese | 0.2 /100 | #261 | Tragic 7.4% |
| Immigrants | Somalia | 0.2 /100 | #262 | Tragic 7.4% |
| Immigrants | Nicaragua | 0.2 /100 | #263 | Tragic 7.4% |
| Yaqui | 0.1 /100 | #264 | Tragic 7.4% |
| Crow | 0.1 /100 | #265 | Tragic 7.4% |
| Nepalese | 0.1 /100 | #266 | Tragic 7.5% |
| Blackfeet | 0.1 /100 | #267 | Tragic 7.5% |
| Indonesians | 0.1 /100 | #268 | Tragic 7.5% |
| Somalis | 0.1 /100 | #269 | Tragic 7.5% |
| Immigrants | Cuba | 0.1 /100 | #270 | Tragic 7.5% |
| Salvadorans | 0.1 /100 | #271 | Tragic 7.5% |
| Immigrants | Azores | 0.1 /100 | #272 | Tragic 7.5% |
| Belizeans | 0.1 /100 | #273 | Tragic 7.6% |
| Immigrants | Guyana | 0.1 /100 | #274 | Tragic 7.6% |
| Central American Indians | 0.1 /100 | #275 | Tragic 7.6% |
| Guyanese | 0.1 /100 | #276 | Tragic 7.6% |
| Immigrants | Trinidad and Tobago | 0.1 /100 | #277 | Tragic 7.6% |