Slovak vs Immigrants from Nicaragua Single Mother Households
COMPARE
Slovak
Immigrants from Nicaragua
Single Mother Households
Single Mother Households Comparison
Slovaks
Immigrants from Nicaragua
5.7%
SINGLE MOTHER HOUSEHOLDS
96.6/ 100
METRIC RATING
95th/ 347
METRIC RANK
7.4%
SINGLE MOTHER HOUSEHOLDS
0.2/ 100
METRIC RATING
263rd/ 347
METRIC RANK
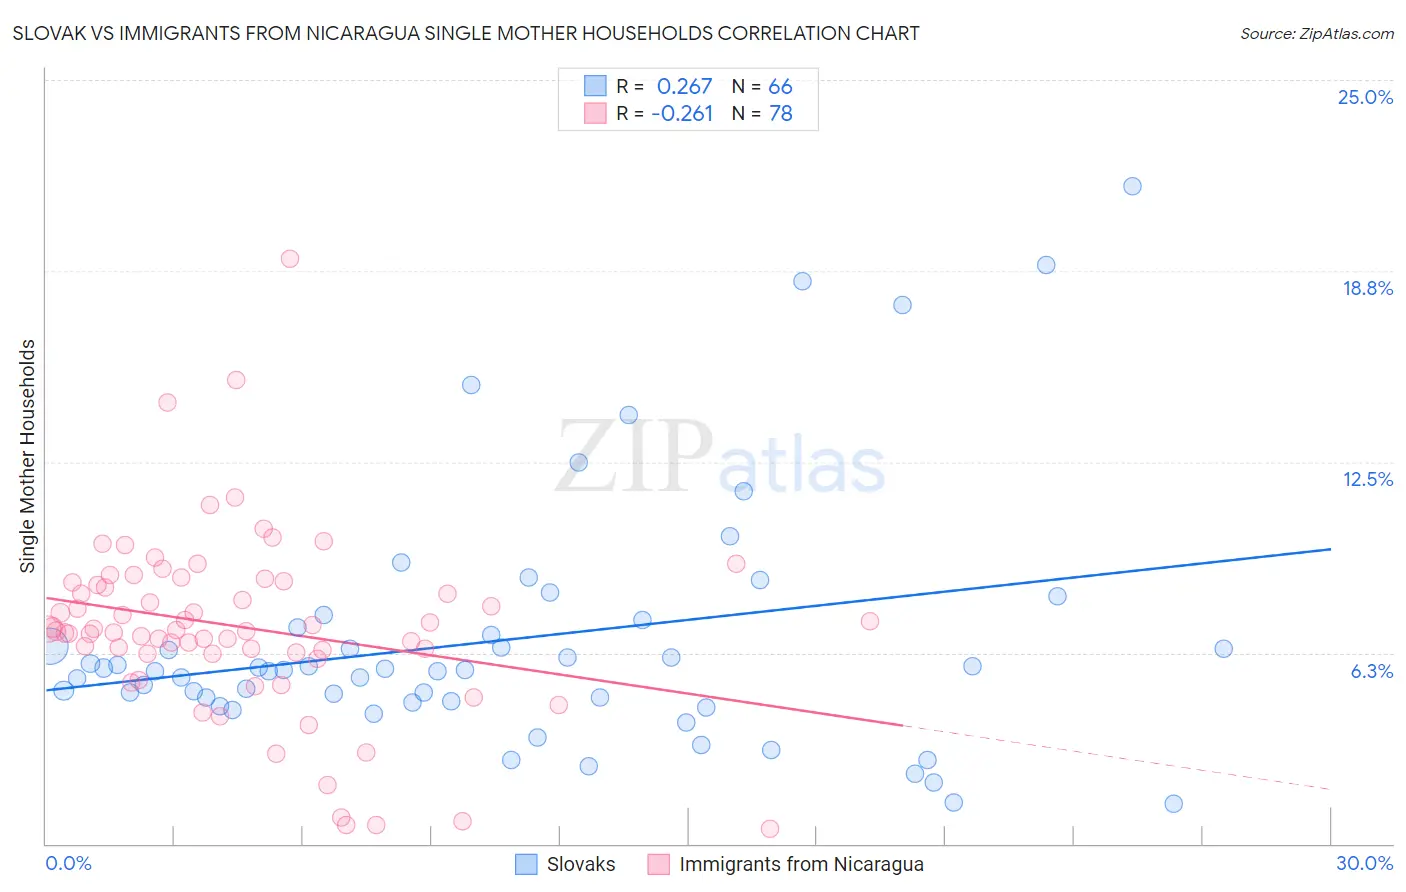
Slovak vs Immigrants from Nicaragua Single Mother Households Correlation Chart
The statistical analysis conducted on geographies consisting of 396,232,122 people shows a weak positive correlation between the proportion of Slovaks and percentage of single mother households in the United States with a correlation coefficient (R) of 0.267 and weighted average of 5.7%. Similarly, the statistical analysis conducted on geographies consisting of 236,236,713 people shows a weak negative correlation between the proportion of Immigrants from Nicaragua and percentage of single mother households in the United States with a correlation coefficient (R) of -0.261 and weighted average of 7.4%, a difference of 29.6%.
Single Mother Households Correlation Summary
| Measurement | Slovak | Immigrants from Nicaragua |
| Minimum | 1.3% | 0.51% |
| Maximum | 21.5% | 19.1% |
| Range | 20.2% | 18.6% |
| Mean | 6.7% | 7.1% |
| Median | 5.7% | 7.0% |
| Interquartile 25% (IQ1) | 4.7% | 6.2% |
| Interquartile 75% (IQ3) | 7.1% | 8.5% |
| Interquartile Range (IQR) | 2.4% | 2.3% |
| Standard Deviation (Sample) | 4.1% | 3.0% |
| Standard Deviation (Population) | 4.1% | 3.0% |
Similar Demographics by Single Mother Households
Demographics Similar to Slovaks by Single Mother Households
In terms of single mother households, the demographic groups most similar to Slovaks are Basque (5.7%, a difference of 0.060%), Serbian (5.7%, a difference of 0.11%), Immigrants from Western Asia (5.7%, a difference of 0.12%), Austrian (5.7%, a difference of 0.15%), and Tlingit-Haida (5.7%, a difference of 0.20%).
| Demographics | Rating | Rank | Single Mother Households |
| Israelis | 97.4 /100 | #88 | Exceptional 5.7% |
| Ukrainians | 97.2 /100 | #89 | Exceptional 5.7% |
| Immigrants | Indonesia | 97.2 /100 | #90 | Exceptional 5.7% |
| Europeans | 97.0 /100 | #91 | Exceptional 5.7% |
| Immigrants | Western Asia | 96.7 /100 | #92 | Exceptional 5.7% |
| Serbians | 96.7 /100 | #93 | Exceptional 5.7% |
| Basques | 96.7 /100 | #94 | Exceptional 5.7% |
| Slovaks | 96.6 /100 | #95 | Exceptional 5.7% |
| Austrians | 96.4 /100 | #96 | Exceptional 5.7% |
| Tlingit-Haida | 96.4 /100 | #97 | Exceptional 5.7% |
| Immigrants | South Africa | 96.3 /100 | #98 | Exceptional 5.7% |
| Immigrants | Poland | 96.3 /100 | #99 | Exceptional 5.8% |
| Scandinavians | 96.2 /100 | #100 | Exceptional 5.8% |
| Germans | 96.2 /100 | #101 | Exceptional 5.8% |
| English | 96.2 /100 | #102 | Exceptional 5.8% |
Demographics Similar to Immigrants from Nicaragua by Single Mother Households
In terms of single mother households, the demographic groups most similar to Immigrants from Nicaragua are Yaqui (7.4%, a difference of 0.080%), Immigrants from Somalia (7.4%, a difference of 0.15%), Crow (7.4%, a difference of 0.25%), Japanese (7.4%, a difference of 0.35%), and Nepalese (7.5%, a difference of 0.35%).
| Demographics | Rating | Rank | Single Mother Households |
| Seminole | 0.2 /100 | #256 | Tragic 7.4% |
| Alaska Natives | 0.2 /100 | #257 | Tragic 7.4% |
| Pueblo | 0.2 /100 | #258 | Tragic 7.4% |
| Immigrants | Yemen | 0.2 /100 | #259 | Tragic 7.4% |
| Immigrants | Zaire | 0.2 /100 | #260 | Tragic 7.4% |
| Japanese | 0.2 /100 | #261 | Tragic 7.4% |
| Immigrants | Somalia | 0.2 /100 | #262 | Tragic 7.4% |
| Immigrants | Nicaragua | 0.2 /100 | #263 | Tragic 7.4% |
| Yaqui | 0.1 /100 | #264 | Tragic 7.4% |
| Crow | 0.1 /100 | #265 | Tragic 7.4% |
| Nepalese | 0.1 /100 | #266 | Tragic 7.5% |
| Blackfeet | 0.1 /100 | #267 | Tragic 7.5% |
| Indonesians | 0.1 /100 | #268 | Tragic 7.5% |
| Somalis | 0.1 /100 | #269 | Tragic 7.5% |
| Immigrants | Cuba | 0.1 /100 | #270 | Tragic 7.5% |