Nigerian vs Immigrants from Nicaragua Single Mother Households
COMPARE
Nigerian
Immigrants from Nicaragua
Single Mother Households
Single Mother Households Comparison
Nigerians
Immigrants from Nicaragua
7.7%
SINGLE MOTHER HOUSEHOLDS
0.0/ 100
METRIC RATING
283rd/ 347
METRIC RANK
7.4%
SINGLE MOTHER HOUSEHOLDS
0.2/ 100
METRIC RATING
263rd/ 347
METRIC RANK
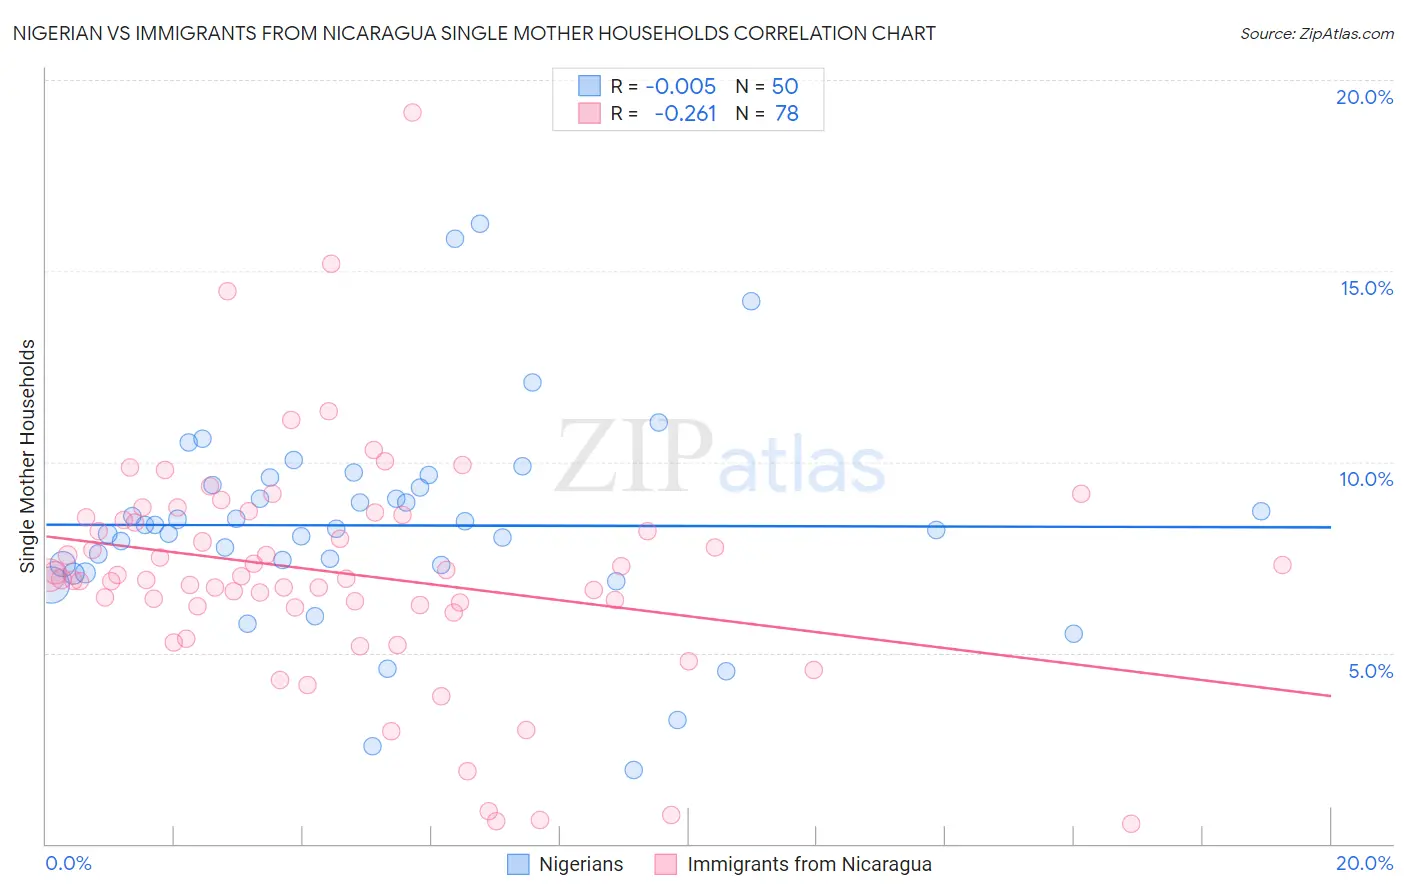
Nigerian vs Immigrants from Nicaragua Single Mother Households Correlation Chart
The statistical analysis conducted on geographies consisting of 332,046,179 people shows no correlation between the proportion of Nigerians and percentage of single mother households in the United States with a correlation coefficient (R) of -0.005 and weighted average of 7.7%. Similarly, the statistical analysis conducted on geographies consisting of 236,236,713 people shows a weak negative correlation between the proportion of Immigrants from Nicaragua and percentage of single mother households in the United States with a correlation coefficient (R) of -0.261 and weighted average of 7.4%, a difference of 3.2%.
Single Mother Households Correlation Summary
| Measurement | Nigerian | Immigrants from Nicaragua |
| Minimum | 1.9% | 0.51% |
| Maximum | 16.2% | 19.1% |
| Range | 14.3% | 18.6% |
| Mean | 8.3% | 7.1% |
| Median | 8.3% | 7.0% |
| Interquartile 25% (IQ1) | 7.3% | 6.2% |
| Interquartile 75% (IQ3) | 9.4% | 8.5% |
| Interquartile Range (IQR) | 2.1% | 2.3% |
| Standard Deviation (Sample) | 2.7% | 3.0% |
| Standard Deviation (Population) | 2.7% | 3.0% |
Demographics Similar to Nigerians and Immigrants from Nicaragua by Single Mother Households
In terms of single mother households, the demographic groups most similar to Nigerians are Guatemalan (7.7%, a difference of 0.030%), Immigrants from Sierra Leone (7.7%, a difference of 0.050%), Immigrants from Laos (7.7%, a difference of 0.050%), Immigrants from El Salvador (7.6%, a difference of 0.57%), and Immigrants from Trinidad and Tobago (7.6%, a difference of 0.80%). Similarly, the demographic groups most similar to Immigrants from Nicaragua are Yaqui (7.4%, a difference of 0.080%), Crow (7.4%, a difference of 0.25%), Nepalese (7.5%, a difference of 0.35%), Blackfeet (7.5%, a difference of 0.69%), and Indonesian (7.5%, a difference of 0.73%).
| Demographics | Rating | Rank | Single Mother Households |
| Immigrants | Nicaragua | 0.2 /100 | #263 | Tragic 7.4% |
| Yaqui | 0.1 /100 | #264 | Tragic 7.4% |
| Crow | 0.1 /100 | #265 | Tragic 7.4% |
| Nepalese | 0.1 /100 | #266 | Tragic 7.5% |
| Blackfeet | 0.1 /100 | #267 | Tragic 7.5% |
| Indonesians | 0.1 /100 | #268 | Tragic 7.5% |
| Somalis | 0.1 /100 | #269 | Tragic 7.5% |
| Immigrants | Cuba | 0.1 /100 | #270 | Tragic 7.5% |
| Salvadorans | 0.1 /100 | #271 | Tragic 7.5% |
| Immigrants | Azores | 0.1 /100 | #272 | Tragic 7.5% |
| Belizeans | 0.1 /100 | #273 | Tragic 7.6% |
| Immigrants | Guyana | 0.1 /100 | #274 | Tragic 7.6% |
| Central American Indians | 0.1 /100 | #275 | Tragic 7.6% |
| Guyanese | 0.1 /100 | #276 | Tragic 7.6% |
| Immigrants | Trinidad and Tobago | 0.1 /100 | #277 | Tragic 7.6% |
| Central Americans | 0.1 /100 | #278 | Tragic 7.6% |
| Immigrants | El Salvador | 0.0 /100 | #279 | Tragic 7.6% |
| Immigrants | Sierra Leone | 0.0 /100 | #280 | Tragic 7.7% |
| Immigrants | Laos | 0.0 /100 | #281 | Tragic 7.7% |
| Guatemalans | 0.0 /100 | #282 | Tragic 7.7% |
| Nigerians | 0.0 /100 | #283 | Tragic 7.7% |