Iranian vs Immigrants from Nicaragua Single Mother Households
COMPARE
Iranian
Immigrants from Nicaragua
Single Mother Households
Single Mother Households Comparison
Iranians
Immigrants from Nicaragua
5.0%
SINGLE MOTHER HOUSEHOLDS
100.0/ 100
METRIC RATING
7th/ 347
METRIC RANK
7.4%
SINGLE MOTHER HOUSEHOLDS
0.2/ 100
METRIC RATING
263rd/ 347
METRIC RANK
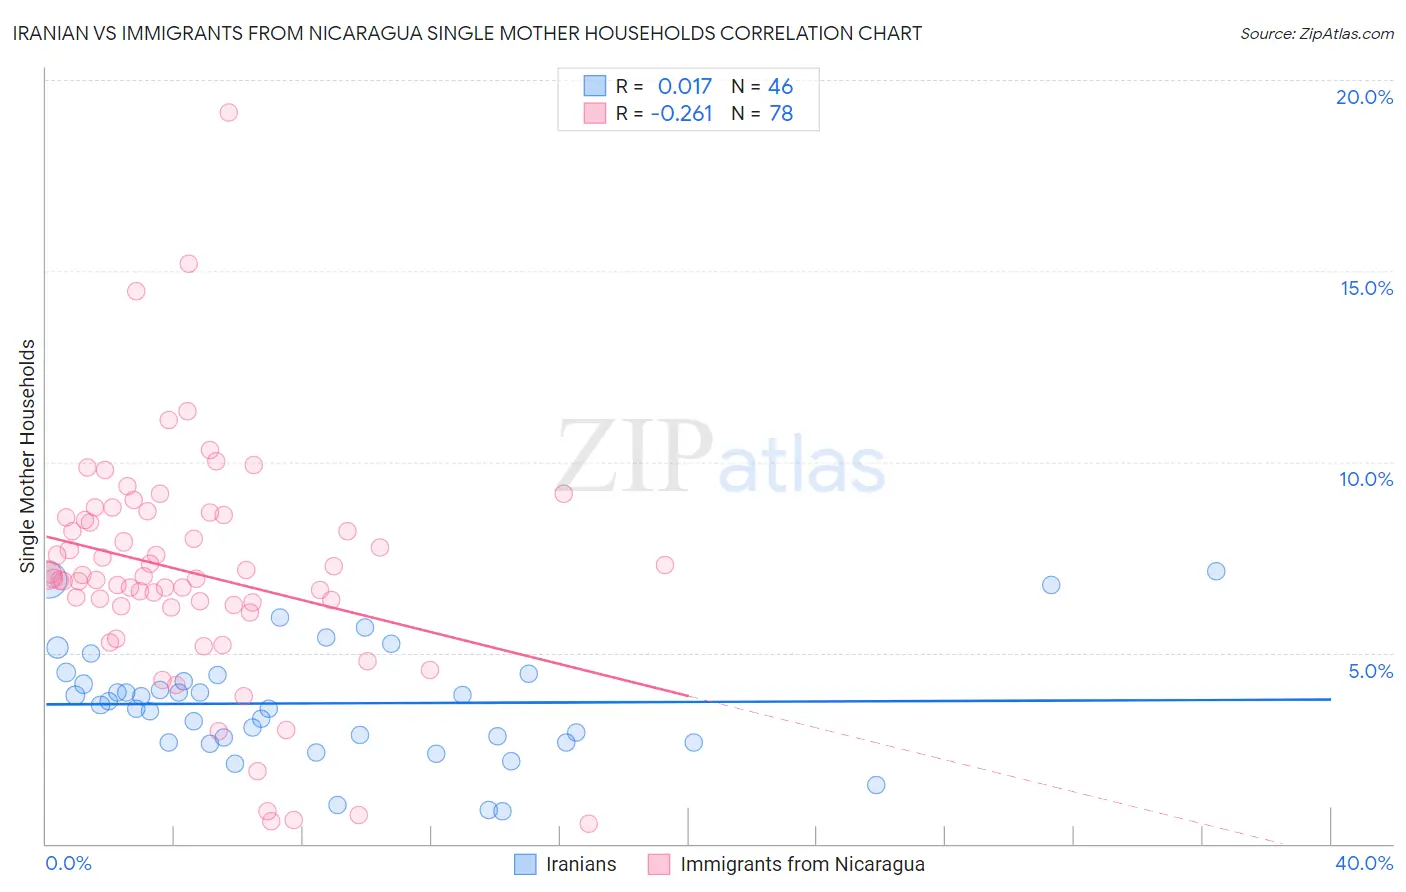
Iranian vs Immigrants from Nicaragua Single Mother Households Correlation Chart
The statistical analysis conducted on geographies consisting of 316,158,075 people shows no correlation between the proportion of Iranians and percentage of single mother households in the United States with a correlation coefficient (R) of 0.017 and weighted average of 5.0%. Similarly, the statistical analysis conducted on geographies consisting of 236,236,713 people shows a weak negative correlation between the proportion of Immigrants from Nicaragua and percentage of single mother households in the United States with a correlation coefficient (R) of -0.261 and weighted average of 7.4%, a difference of 49.4%.
Single Mother Households Correlation Summary
| Measurement | Iranian | Immigrants from Nicaragua |
| Minimum | 0.85% | 0.51% |
| Maximum | 7.1% | 19.1% |
| Range | 6.3% | 18.6% |
| Mean | 3.7% | 7.1% |
| Median | 3.7% | 7.0% |
| Interquartile 25% (IQ1) | 2.7% | 6.2% |
| Interquartile 75% (IQ3) | 4.4% | 8.5% |
| Interquartile Range (IQR) | 1.8% | 2.3% |
| Standard Deviation (Sample) | 1.5% | 3.0% |
| Standard Deviation (Population) | 1.5% | 3.0% |
Similar Demographics by Single Mother Households
Demographics Similar to Iranians by Single Mother Households
In terms of single mother households, the demographic groups most similar to Iranians are Immigrants from Singapore (5.0%, a difference of 0.25%), Immigrants from Ireland (5.0%, a difference of 0.66%), Okinawan (5.0%, a difference of 0.81%), Immigrants from Israel (5.0%, a difference of 1.1%), and Immigrants from China (5.1%, a difference of 1.8%).
| Demographics | Rating | Rank | Single Mother Households |
| Immigrants | Taiwan | 100.0 /100 | #1 | Exceptional 4.7% |
| Filipinos | 100.0 /100 | #2 | Exceptional 4.7% |
| Immigrants | Iran | 100.0 /100 | #3 | Exceptional 4.8% |
| Assyrians/Chaldeans/Syriacs | 100.0 /100 | #4 | Exceptional 4.8% |
| Immigrants | Hong Kong | 100.0 /100 | #5 | Exceptional 4.8% |
| Immigrants | Singapore | 100.0 /100 | #6 | Exceptional 5.0% |
| Iranians | 100.0 /100 | #7 | Exceptional 5.0% |
| Immigrants | Ireland | 99.9 /100 | #8 | Exceptional 5.0% |
| Okinawans | 99.9 /100 | #9 | Exceptional 5.0% |
| Immigrants | Israel | 99.9 /100 | #10 | Exceptional 5.0% |
| Immigrants | China | 99.9 /100 | #11 | Exceptional 5.1% |
| Cypriots | 99.9 /100 | #12 | Exceptional 5.1% |
| Immigrants | India | 99.9 /100 | #13 | Exceptional 5.1% |
| Immigrants | Australia | 99.9 /100 | #14 | Exceptional 5.1% |
| Immigrants | Eastern Asia | 99.9 /100 | #15 | Exceptional 5.1% |
Demographics Similar to Immigrants from Nicaragua by Single Mother Households
In terms of single mother households, the demographic groups most similar to Immigrants from Nicaragua are Yaqui (7.4%, a difference of 0.080%), Immigrants from Somalia (7.4%, a difference of 0.15%), Crow (7.4%, a difference of 0.25%), Japanese (7.4%, a difference of 0.35%), and Nepalese (7.5%, a difference of 0.35%).
| Demographics | Rating | Rank | Single Mother Households |
| Seminole | 0.2 /100 | #256 | Tragic 7.4% |
| Alaska Natives | 0.2 /100 | #257 | Tragic 7.4% |
| Pueblo | 0.2 /100 | #258 | Tragic 7.4% |
| Immigrants | Yemen | 0.2 /100 | #259 | Tragic 7.4% |
| Immigrants | Zaire | 0.2 /100 | #260 | Tragic 7.4% |
| Japanese | 0.2 /100 | #261 | Tragic 7.4% |
| Immigrants | Somalia | 0.2 /100 | #262 | Tragic 7.4% |
| Immigrants | Nicaragua | 0.2 /100 | #263 | Tragic 7.4% |
| Yaqui | 0.1 /100 | #264 | Tragic 7.4% |
| Crow | 0.1 /100 | #265 | Tragic 7.4% |
| Nepalese | 0.1 /100 | #266 | Tragic 7.5% |
| Blackfeet | 0.1 /100 | #267 | Tragic 7.5% |
| Indonesians | 0.1 /100 | #268 | Tragic 7.5% |
| Somalis | 0.1 /100 | #269 | Tragic 7.5% |
| Immigrants | Cuba | 0.1 /100 | #270 | Tragic 7.5% |