Immigrants from Norway vs Central American Single Mother Households
COMPARE
Immigrants from Norway
Central American
Single Mother Households
Single Mother Households Comparison
Immigrants from Norway
Central Americans
5.6%
SINGLE MOTHER HOUSEHOLDS
98.7/ 100
METRIC RATING
60th/ 347
METRIC RANK
7.6%
SINGLE MOTHER HOUSEHOLDS
0.1/ 100
METRIC RATING
278th/ 347
METRIC RANK
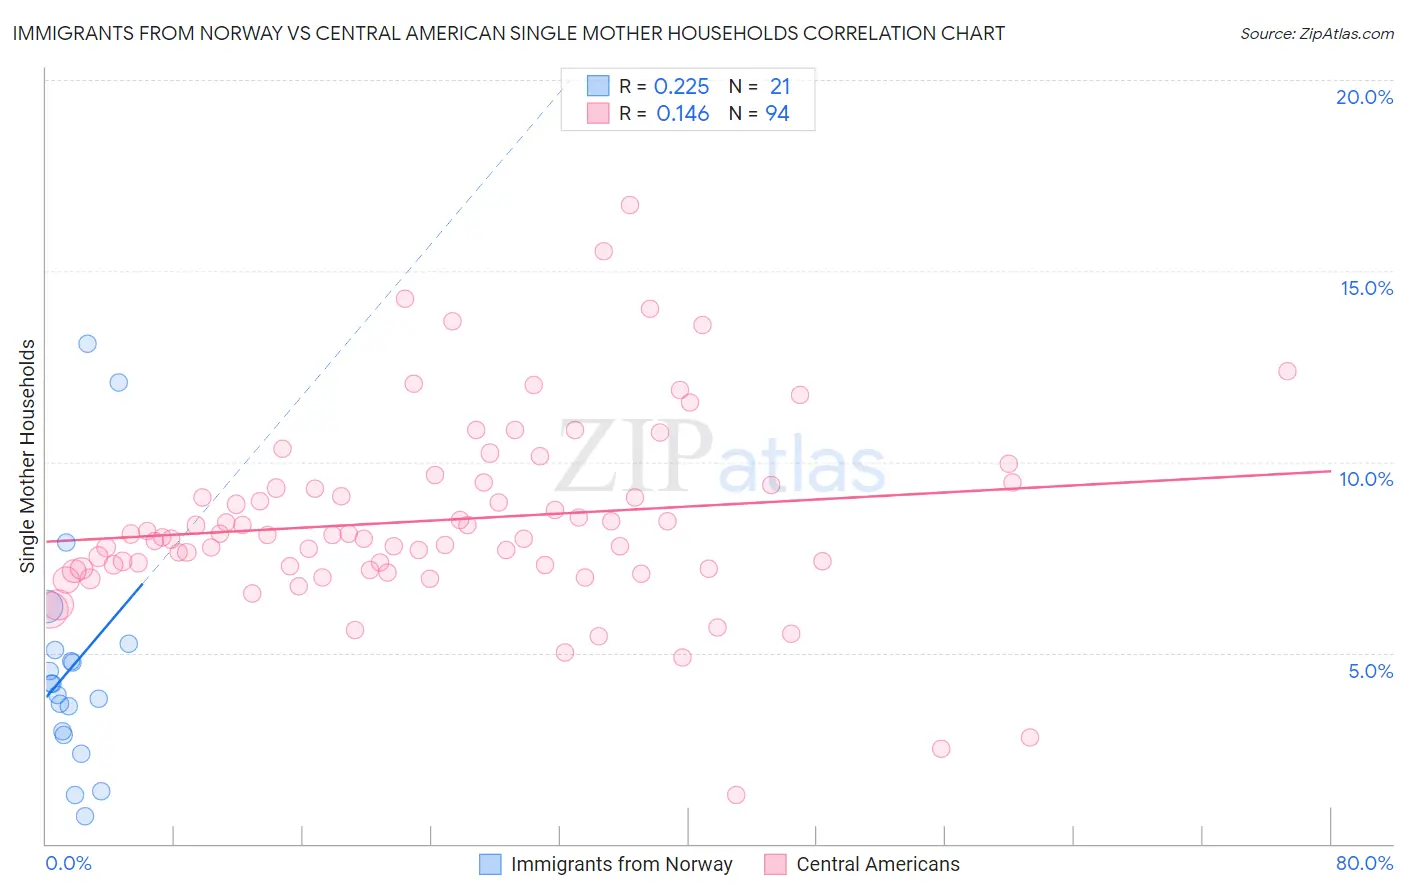
Immigrants from Norway vs Central American Single Mother Households Correlation Chart
The statistical analysis conducted on geographies consisting of 116,559,086 people shows a weak positive correlation between the proportion of Immigrants from Norway and percentage of single mother households in the United States with a correlation coefficient (R) of 0.225 and weighted average of 5.6%. Similarly, the statistical analysis conducted on geographies consisting of 502,537,291 people shows a poor positive correlation between the proportion of Central Americans and percentage of single mother households in the United States with a correlation coefficient (R) of 0.146 and weighted average of 7.6%, a difference of 36.6%.
Single Mother Households Correlation Summary
| Measurement | Immigrants from Norway | Central American |
| Minimum | 0.71% | 1.3% |
| Maximum | 13.1% | 16.7% |
| Range | 12.4% | 15.5% |
| Mean | 4.7% | 8.5% |
| Median | 4.2% | 8.0% |
| Interquartile 25% (IQ1) | 2.9% | 7.2% |
| Interquartile 75% (IQ3) | 5.2% | 9.4% |
| Interquartile Range (IQR) | 2.3% | 2.2% |
| Standard Deviation (Sample) | 3.1% | 2.5% |
| Standard Deviation (Population) | 3.0% | 2.5% |
Similar Demographics by Single Mother Households
Demographics Similar to Immigrants from Norway by Single Mother Households
In terms of single mother households, the demographic groups most similar to Immigrants from Norway are Australian (5.6%, a difference of 0.070%), Polish (5.6%, a difference of 0.080%), Luxembourger (5.6%, a difference of 0.15%), Immigrants from North Macedonia (5.6%, a difference of 0.15%), and Immigrants from France (5.6%, a difference of 0.18%).
| Demographics | Rating | Rank | Single Mother Households |
| Immigrants | Russia | 99.1 /100 | #53 | Exceptional 5.5% |
| Immigrants | Lebanon | 99.1 /100 | #54 | Exceptional 5.5% |
| Immigrants | Denmark | 99.1 /100 | #55 | Exceptional 5.5% |
| Immigrants | Romania | 99.0 /100 | #56 | Exceptional 5.5% |
| Immigrants | Europe | 99.0 /100 | #57 | Exceptional 5.5% |
| Danes | 98.9 /100 | #58 | Exceptional 5.5% |
| Luxembourgers | 98.7 /100 | #59 | Exceptional 5.6% |
| Immigrants | Norway | 98.7 /100 | #60 | Exceptional 5.6% |
| Australians | 98.7 /100 | #61 | Exceptional 5.6% |
| Poles | 98.6 /100 | #62 | Exceptional 5.6% |
| Immigrants | North Macedonia | 98.6 /100 | #63 | Exceptional 5.6% |
| Immigrants | France | 98.6 /100 | #64 | Exceptional 5.6% |
| Greeks | 98.6 /100 | #65 | Exceptional 5.6% |
| Immigrants | Canada | 98.5 /100 | #66 | Exceptional 5.6% |
| Italians | 98.5 /100 | #67 | Exceptional 5.6% |
Demographics Similar to Central Americans by Single Mother Households
In terms of single mother households, the demographic groups most similar to Central Americans are Immigrants from Trinidad and Tobago (7.6%, a difference of 0.0%), Guyanese (7.6%, a difference of 0.050%), Immigrants from El Salvador (7.6%, a difference of 0.22%), Central American Indian (7.6%, a difference of 0.49%), and Immigrants from Guyana (7.6%, a difference of 0.59%).
| Demographics | Rating | Rank | Single Mother Households |
| Salvadorans | 0.1 /100 | #271 | Tragic 7.5% |
| Immigrants | Azores | 0.1 /100 | #272 | Tragic 7.5% |
| Belizeans | 0.1 /100 | #273 | Tragic 7.6% |
| Immigrants | Guyana | 0.1 /100 | #274 | Tragic 7.6% |
| Central American Indians | 0.1 /100 | #275 | Tragic 7.6% |
| Guyanese | 0.1 /100 | #276 | Tragic 7.6% |
| Immigrants | Trinidad and Tobago | 0.1 /100 | #277 | Tragic 7.6% |
| Central Americans | 0.1 /100 | #278 | Tragic 7.6% |
| Immigrants | El Salvador | 0.0 /100 | #279 | Tragic 7.6% |
| Immigrants | Sierra Leone | 0.0 /100 | #280 | Tragic 7.7% |
| Immigrants | Laos | 0.0 /100 | #281 | Tragic 7.7% |
| Guatemalans | 0.0 /100 | #282 | Tragic 7.7% |
| Nigerians | 0.0 /100 | #283 | Tragic 7.7% |
| Immigrants | Belize | 0.0 /100 | #284 | Tragic 7.7% |
| Trinidadians and Tobagonians | 0.0 /100 | #285 | Tragic 7.7% |