Immigrants from Northern Europe vs Guamanian/Chamorro Family Households
COMPARE
Immigrants from Northern Europe
Guamanian/Chamorro
Family Households
Family Households Comparison
Immigrants from Northern Europe
Guamanians/Chamorros
63.8%
FAMILY HOUSEHOLDS
8.8/ 100
METRIC RATING
213th/ 347
METRIC RANK
66.6%
FAMILY HOUSEHOLDS
100.0/ 100
METRIC RATING
40th/ 347
METRIC RANK
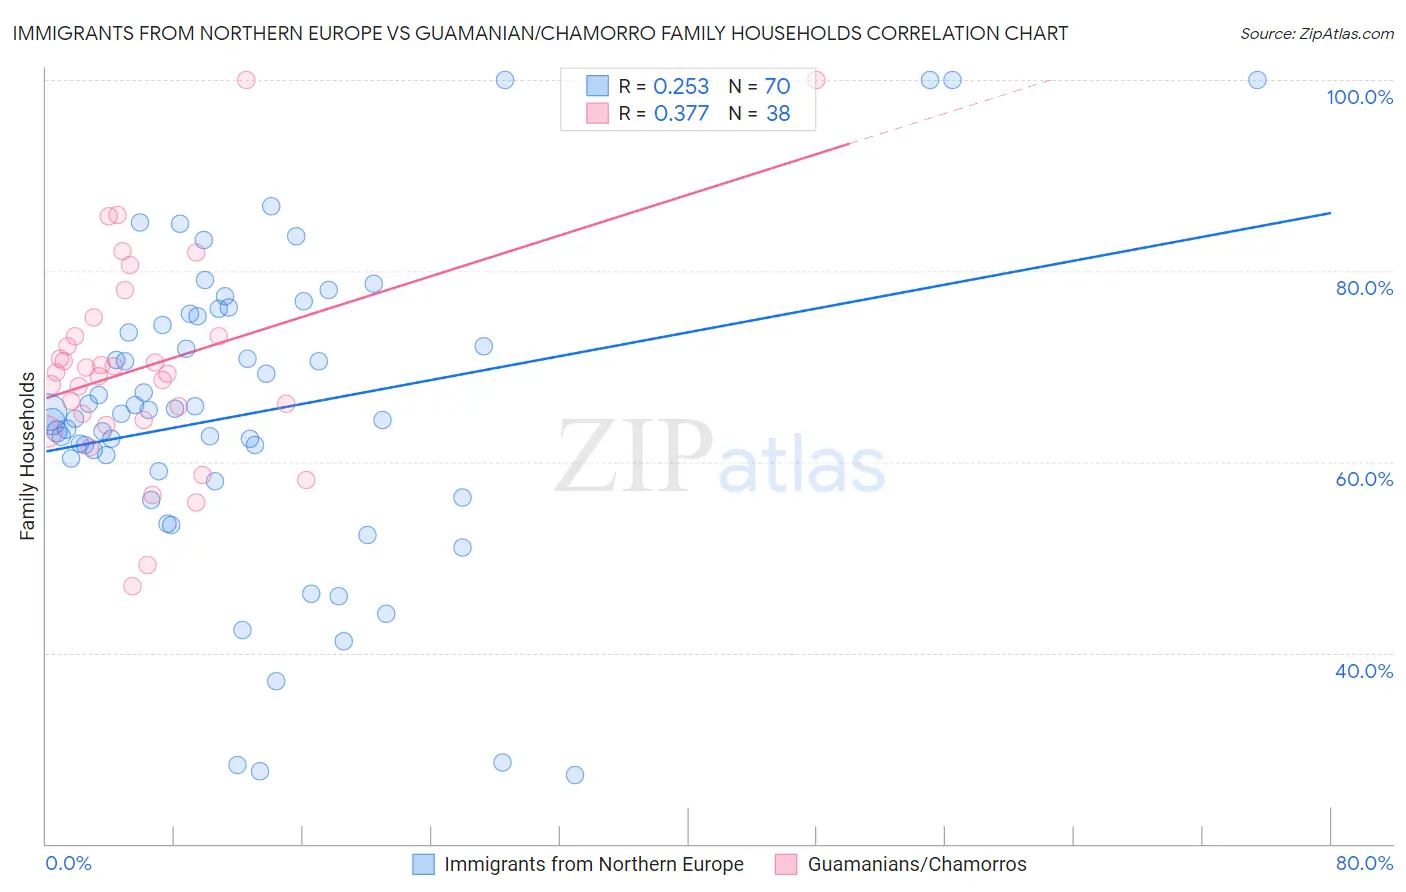
Immigrants from Northern Europe vs Guamanian/Chamorro Family Households Correlation Chart
The statistical analysis conducted on geographies consisting of 476,950,650 people shows a weak positive correlation between the proportion of Immigrants from Northern Europe and percentage of family households in the United States with a correlation coefficient (R) of 0.253 and weighted average of 63.8%. Similarly, the statistical analysis conducted on geographies consisting of 221,865,945 people shows a mild positive correlation between the proportion of Guamanians/Chamorros and percentage of family households in the United States with a correlation coefficient (R) of 0.377 and weighted average of 66.6%, a difference of 4.4%.
Family Households Correlation Summary
| Measurement | Immigrants from Northern Europe | Guamanian/Chamorro |
| Minimum | 27.1% | 47.0% |
| Maximum | 100.0% | 100.0% |
| Range | 72.9% | 53.0% |
| Mean | 65.2% | 70.1% |
| Median | 65.1% | 69.3% |
| Interquartile 25% (IQ1) | 59.0% | 64.4% |
| Interquartile 75% (IQ3) | 75.3% | 73.2% |
| Interquartile Range (IQR) | 16.3% | 8.8% |
| Standard Deviation (Sample) | 16.2% | 11.3% |
| Standard Deviation (Population) | 16.1% | 11.1% |
Similar Demographics by Family Households
Demographics Similar to Immigrants from Northern Europe by Family Households
In terms of family households, the demographic groups most similar to Immigrants from Northern Europe are Shoshone (63.8%, a difference of 0.020%), Immigrants from Netherlands (63.8%, a difference of 0.020%), Immigrants from Thailand (63.8%, a difference of 0.030%), Celtic (63.8%, a difference of 0.040%), and Belgian (63.8%, a difference of 0.060%).
| Demographics | Rating | Rank | Family Households |
| Immigrants | Lithuania | 12.1 /100 | #206 | Poor 63.9% |
| Nigerians | 11.5 /100 | #207 | Poor 63.9% |
| Immigrants | Bangladesh | 11.4 /100 | #208 | Poor 63.9% |
| Sierra Leoneans | 11.2 /100 | #209 | Poor 63.9% |
| Immigrants | Thailand | 9.6 /100 | #210 | Tragic 63.8% |
| Shoshone | 9.4 /100 | #211 | Tragic 63.8% |
| Immigrants | Netherlands | 9.4 /100 | #212 | Tragic 63.8% |
| Immigrants | Northern Europe | 8.8 /100 | #213 | Tragic 63.8% |
| Celtics | 8.0 /100 | #214 | Tragic 63.8% |
| Belgians | 7.6 /100 | #215 | Tragic 63.8% |
| Croatians | 7.3 /100 | #216 | Tragic 63.8% |
| Osage | 7.0 /100 | #217 | Tragic 63.7% |
| Marshallese | 6.9 /100 | #218 | Tragic 63.7% |
| Macedonians | 6.5 /100 | #219 | Tragic 63.7% |
| Immigrants | Europe | 6.4 /100 | #220 | Tragic 63.7% |
Demographics Similar to Guamanians/Chamorros by Family Households
In terms of family households, the demographic groups most similar to Guamanians/Chamorros are Immigrants from Bolivia (66.6%, a difference of 0.030%), Menominee (66.5%, a difference of 0.090%), Apache (66.5%, a difference of 0.10%), Asian (66.5%, a difference of 0.15%), and Venezuelan (66.5%, a difference of 0.17%).
| Demographics | Rating | Rank | Family Households |
| Salvadorans | 100.0 /100 | #33 | Exceptional 67.2% |
| Thais | 100.0 /100 | #34 | Exceptional 67.2% |
| Tohono O'odham | 100.0 /100 | #35 | Exceptional 67.1% |
| Peruvians | 100.0 /100 | #36 | Exceptional 67.1% |
| Tsimshian | 100.0 /100 | #37 | Exceptional 67.1% |
| Mexican American Indians | 100.0 /100 | #38 | Exceptional 67.0% |
| Immigrants | El Salvador | 100.0 /100 | #39 | Exceptional 67.0% |
| Guamanians/Chamorros | 100.0 /100 | #40 | Exceptional 66.6% |
| Immigrants | Bolivia | 100.0 /100 | #41 | Exceptional 66.6% |
| Menominee | 100.0 /100 | #42 | Exceptional 66.5% |
| Apache | 100.0 /100 | #43 | Exceptional 66.5% |
| Asians | 100.0 /100 | #44 | Exceptional 66.5% |
| Venezuelans | 100.0 /100 | #45 | Exceptional 66.5% |
| Arapaho | 100.0 /100 | #46 | Exceptional 66.5% |
| Bolivians | 100.0 /100 | #47 | Exceptional 66.5% |