Immigrants from Northern Europe vs Czech Family Households
COMPARE
Immigrants from Northern Europe
Czech
Family Households
Family Households Comparison
Immigrants from Northern Europe
Czechs
63.8%
FAMILY HOUSEHOLDS
8.8/ 100
METRIC RATING
213th/ 347
METRIC RANK
64.5%
FAMILY HOUSEHOLDS
67.0/ 100
METRIC RATING
156th/ 347
METRIC RANK
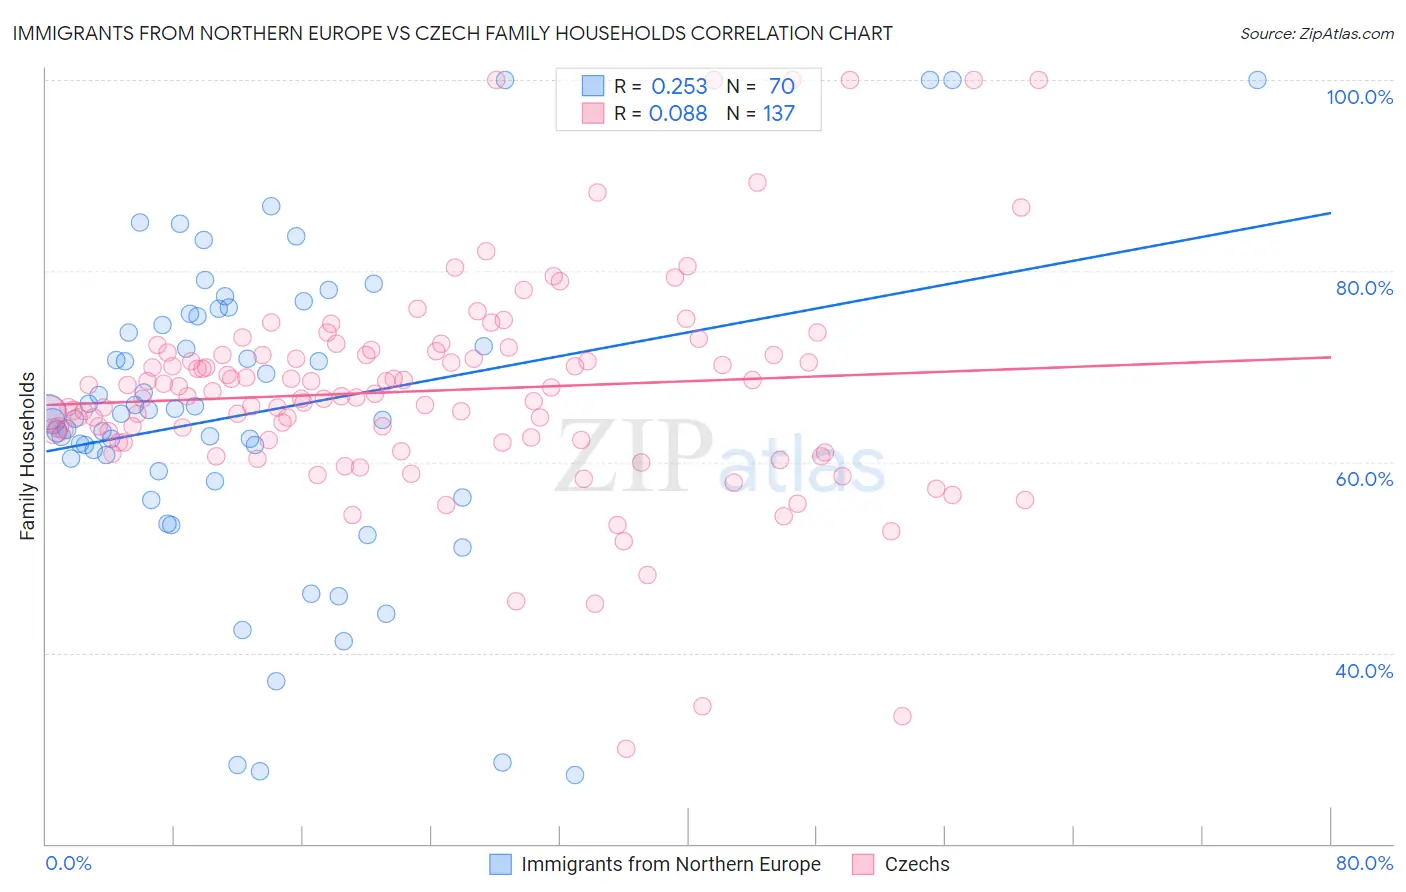
Immigrants from Northern Europe vs Czech Family Households Correlation Chart
The statistical analysis conducted on geographies consisting of 476,950,650 people shows a weak positive correlation between the proportion of Immigrants from Northern Europe and percentage of family households in the United States with a correlation coefficient (R) of 0.253 and weighted average of 63.8%. Similarly, the statistical analysis conducted on geographies consisting of 484,475,433 people shows a slight positive correlation between the proportion of Czechs and percentage of family households in the United States with a correlation coefficient (R) of 0.088 and weighted average of 64.5%, a difference of 1.0%.
Family Households Correlation Summary
| Measurement | Immigrants from Northern Europe | Czech |
| Minimum | 27.1% | 29.9% |
| Maximum | 100.0% | 100.0% |
| Range | 72.9% | 70.1% |
| Mean | 65.2% | 67.4% |
| Median | 65.1% | 66.9% |
| Interquartile 25% (IQ1) | 59.0% | 62.2% |
| Interquartile 75% (IQ3) | 75.3% | 71.4% |
| Interquartile Range (IQR) | 16.3% | 9.2% |
| Standard Deviation (Sample) | 16.2% | 11.4% |
| Standard Deviation (Population) | 16.1% | 11.3% |
Similar Demographics by Family Households
Demographics Similar to Immigrants from Northern Europe by Family Households
In terms of family households, the demographic groups most similar to Immigrants from Northern Europe are Shoshone (63.8%, a difference of 0.020%), Immigrants from Netherlands (63.8%, a difference of 0.020%), Immigrants from Thailand (63.8%, a difference of 0.030%), Celtic (63.8%, a difference of 0.040%), and Belgian (63.8%, a difference of 0.060%).
| Demographics | Rating | Rank | Family Households |
| Immigrants | Lithuania | 12.1 /100 | #206 | Poor 63.9% |
| Nigerians | 11.5 /100 | #207 | Poor 63.9% |
| Immigrants | Bangladesh | 11.4 /100 | #208 | Poor 63.9% |
| Sierra Leoneans | 11.2 /100 | #209 | Poor 63.9% |
| Immigrants | Thailand | 9.6 /100 | #210 | Tragic 63.8% |
| Shoshone | 9.4 /100 | #211 | Tragic 63.8% |
| Immigrants | Netherlands | 9.4 /100 | #212 | Tragic 63.8% |
| Immigrants | Northern Europe | 8.8 /100 | #213 | Tragic 63.8% |
| Celtics | 8.0 /100 | #214 | Tragic 63.8% |
| Belgians | 7.6 /100 | #215 | Tragic 63.8% |
| Croatians | 7.3 /100 | #216 | Tragic 63.8% |
| Osage | 7.0 /100 | #217 | Tragic 63.7% |
| Marshallese | 6.9 /100 | #218 | Tragic 63.7% |
| Macedonians | 6.5 /100 | #219 | Tragic 63.7% |
| Immigrants | Europe | 6.4 /100 | #220 | Tragic 63.7% |
Demographics Similar to Czechs by Family Households
In terms of family households, the demographic groups most similar to Czechs are Uruguayan (64.5%, a difference of 0.010%), Canadian (64.4%, a difference of 0.010%), Lebanese (64.4%, a difference of 0.010%), Austrian (64.5%, a difference of 0.020%), and German (64.4%, a difference of 0.020%).
| Demographics | Rating | Rank | Family Households |
| Sioux | 76.3 /100 | #149 | Good 64.6% |
| Romanians | 75.3 /100 | #150 | Good 64.5% |
| Syrians | 75.2 /100 | #151 | Good 64.5% |
| Scottish | 70.9 /100 | #152 | Good 64.5% |
| Swedes | 69.8 /100 | #153 | Good 64.5% |
| Austrians | 68.5 /100 | #154 | Good 64.5% |
| Uruguayans | 67.7 /100 | #155 | Good 64.5% |
| Czechs | 67.0 /100 | #156 | Good 64.5% |
| Canadians | 66.6 /100 | #157 | Good 64.4% |
| Lebanese | 66.4 /100 | #158 | Good 64.4% |
| Germans | 65.8 /100 | #159 | Good 64.4% |
| Immigrants | Moldova | 65.2 /100 | #160 | Good 64.4% |
| Immigrants | England | 62.6 /100 | #161 | Good 64.4% |
| British | 61.6 /100 | #162 | Good 64.4% |
| Chickasaw | 61.5 /100 | #163 | Good 64.4% |