Immigrants from Northern Europe vs Basque Family Households
COMPARE
Immigrants from Northern Europe
Basque
Family Households
Family Households Comparison
Immigrants from Northern Europe
Basques
63.8%
FAMILY HOUSEHOLDS
8.8/ 100
METRIC RATING
213th/ 347
METRIC RANK
64.7%
FAMILY HOUSEHOLDS
85.5/ 100
METRIC RATING
138th/ 347
METRIC RANK
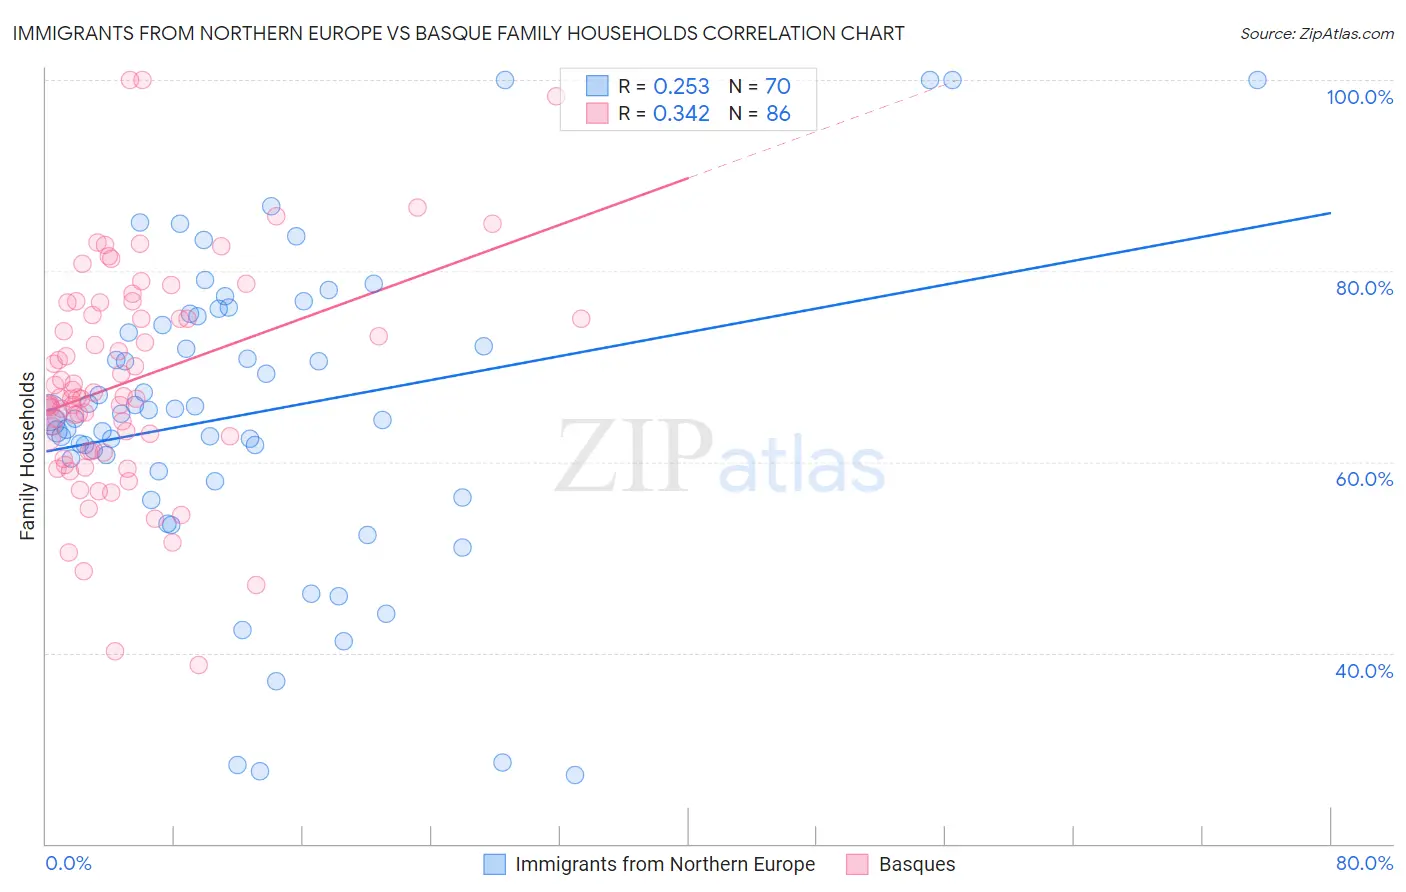
Immigrants from Northern Europe vs Basque Family Households Correlation Chart
The statistical analysis conducted on geographies consisting of 476,950,650 people shows a weak positive correlation between the proportion of Immigrants from Northern Europe and percentage of family households in the United States with a correlation coefficient (R) of 0.253 and weighted average of 63.8%. Similarly, the statistical analysis conducted on geographies consisting of 165,752,297 people shows a mild positive correlation between the proportion of Basques and percentage of family households in the United States with a correlation coefficient (R) of 0.342 and weighted average of 64.7%, a difference of 1.4%.
Family Households Correlation Summary
| Measurement | Immigrants from Northern Europe | Basque |
| Minimum | 27.1% | 38.8% |
| Maximum | 100.0% | 100.0% |
| Range | 72.9% | 61.2% |
| Mean | 65.2% | 68.5% |
| Median | 65.1% | 66.7% |
| Interquartile 25% (IQ1) | 59.0% | 61.1% |
| Interquartile 75% (IQ3) | 75.3% | 75.3% |
| Interquartile Range (IQR) | 16.3% | 14.3% |
| Standard Deviation (Sample) | 16.2% | 11.5% |
| Standard Deviation (Population) | 16.1% | 11.4% |
Similar Demographics by Family Households
Demographics Similar to Immigrants from Northern Europe by Family Households
In terms of family households, the demographic groups most similar to Immigrants from Northern Europe are Shoshone (63.8%, a difference of 0.020%), Immigrants from Netherlands (63.8%, a difference of 0.020%), Immigrants from Thailand (63.8%, a difference of 0.030%), Celtic (63.8%, a difference of 0.040%), and Belgian (63.8%, a difference of 0.060%).
| Demographics | Rating | Rank | Family Households |
| Immigrants | Lithuania | 12.1 /100 | #206 | Poor 63.9% |
| Nigerians | 11.5 /100 | #207 | Poor 63.9% |
| Immigrants | Bangladesh | 11.4 /100 | #208 | Poor 63.9% |
| Sierra Leoneans | 11.2 /100 | #209 | Poor 63.9% |
| Immigrants | Thailand | 9.6 /100 | #210 | Tragic 63.8% |
| Shoshone | 9.4 /100 | #211 | Tragic 63.8% |
| Immigrants | Netherlands | 9.4 /100 | #212 | Tragic 63.8% |
| Immigrants | Northern Europe | 8.8 /100 | #213 | Tragic 63.8% |
| Celtics | 8.0 /100 | #214 | Tragic 63.8% |
| Belgians | 7.6 /100 | #215 | Tragic 63.8% |
| Croatians | 7.3 /100 | #216 | Tragic 63.8% |
| Osage | 7.0 /100 | #217 | Tragic 63.7% |
| Marshallese | 6.9 /100 | #218 | Tragic 63.7% |
| Macedonians | 6.5 /100 | #219 | Tragic 63.7% |
| Immigrants | Europe | 6.4 /100 | #220 | Tragic 63.7% |
Demographics Similar to Basques by Family Households
In terms of family households, the demographic groups most similar to Basques are Immigrants from Jamaica (64.7%, a difference of 0.010%), Immigrants from Scotland (64.7%, a difference of 0.020%), Immigrants from North Macedonia (64.7%, a difference of 0.020%), Immigrants from Cameroon (64.7%, a difference of 0.020%), and Immigrants from China (64.7%, a difference of 0.030%).
| Demographics | Rating | Rank | Family Households |
| Immigrants | Nonimmigrants | 90.1 /100 | #131 | Exceptional 64.8% |
| Cajuns | 89.4 /100 | #132 | Excellent 64.8% |
| Belizeans | 89.3 /100 | #133 | Excellent 64.8% |
| Greeks | 88.1 /100 | #134 | Excellent 64.7% |
| Maltese | 87.4 /100 | #135 | Excellent 64.7% |
| Immigrants | China | 86.6 /100 | #136 | Excellent 64.7% |
| Immigrants | Scotland | 86.4 /100 | #137 | Excellent 64.7% |
| Basques | 85.5 /100 | #138 | Excellent 64.7% |
| Immigrants | Jamaica | 85.3 /100 | #139 | Excellent 64.7% |
| Immigrants | North Macedonia | 84.9 /100 | #140 | Excellent 64.7% |
| Immigrants | Cameroon | 84.8 /100 | #141 | Excellent 64.7% |
| Pakistanis | 84.0 /100 | #142 | Excellent 64.7% |
| Czechoslovakians | 82.1 /100 | #143 | Excellent 64.6% |
| South American Indians | 81.9 /100 | #144 | Excellent 64.6% |
| Welsh | 80.1 /100 | #145 | Excellent 64.6% |