Immigrants from Northern Africa vs Korean Births to Unmarried Women
COMPARE
Immigrants from Northern Africa
Korean
Births to Unmarried Women
Births to Unmarried Women Comparison
Immigrants from Northern Africa
Koreans
29.5%
BIRTHS TO UNMARRIED WOMEN
94.7/ 100
METRIC RATING
101st/ 347
METRIC RANK
30.1%
BIRTHS TO UNMARRIED WOMEN
88.9/ 100
METRIC RATING
121st/ 347
METRIC RANK
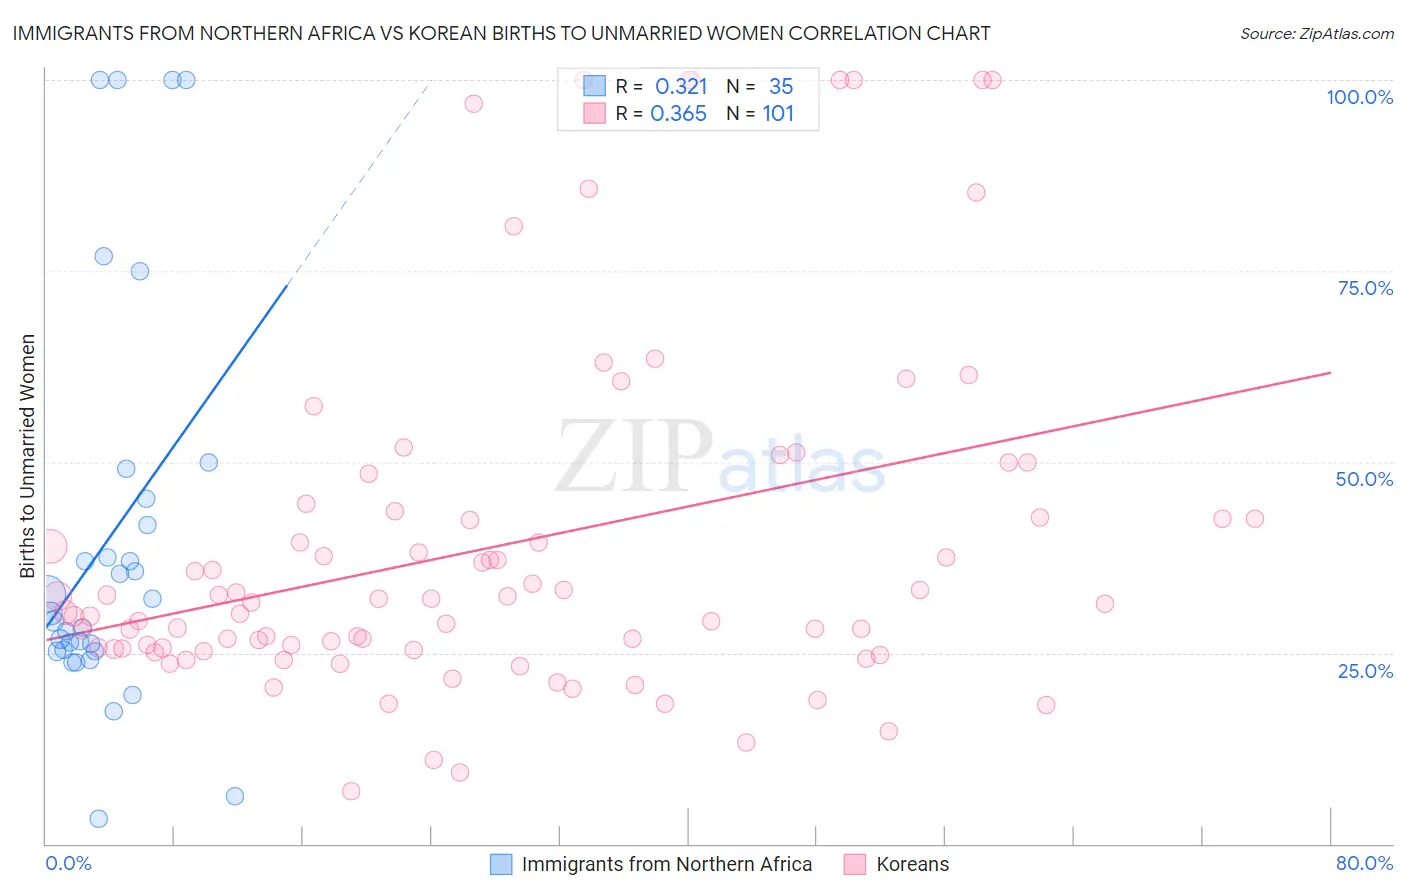
Immigrants from Northern Africa vs Korean Births to Unmarried Women Correlation Chart
The statistical analysis conducted on geographies consisting of 302,719,907 people shows a mild positive correlation between the proportion of Immigrants from Northern Africa and percentage of births to unmarried women in the United States with a correlation coefficient (R) of 0.321 and weighted average of 29.5%. Similarly, the statistical analysis conducted on geographies consisting of 466,988,654 people shows a mild positive correlation between the proportion of Koreans and percentage of births to unmarried women in the United States with a correlation coefficient (R) of 0.365 and weighted average of 30.1%, a difference of 2.0%.
Births to Unmarried Women Correlation Summary
| Measurement | Immigrants from Northern Africa | Korean |
| Minimum | 3.2% | 6.8% |
| Maximum | 100.0% | 100.0% |
| Range | 96.8% | 93.2% |
| Mean | 40.0% | 39.1% |
| Median | 30.2% | 31.5% |
| Interquartile 25% (IQ1) | 25.3% | 25.5% |
| Interquartile 75% (IQ3) | 45.1% | 43.1% |
| Interquartile Range (IQR) | 19.8% | 17.6% |
| Standard Deviation (Sample) | 26.3% | 22.9% |
| Standard Deviation (Population) | 25.9% | 22.8% |
Demographics Similar to Immigrants from Northern Africa and Koreans by Births to Unmarried Women
In terms of births to unmarried women, the demographic groups most similar to Immigrants from Northern Africa are Australian (29.5%, a difference of 0.080%), Lebanese (29.5%, a difference of 0.13%), Lithuanian (29.6%, a difference of 0.14%), Immigrants from Nepal (29.6%, a difference of 0.19%), and Swedish (29.6%, a difference of 0.44%). Similarly, the demographic groups most similar to Koreans are Ugandan (30.1%, a difference of 0.070%), Argentinean (30.0%, a difference of 0.44%), Immigrants from Norway (29.9%, a difference of 0.58%), Immigrants from Netherlands (29.9%, a difference of 0.60%), and Immigrants from Italy (29.9%, a difference of 0.81%).
| Demographics | Rating | Rank | Births to Unmarried Women |
| Immigrants | Northern Africa | 94.7 /100 | #101 | Exceptional 29.5% |
| Australians | 94.6 /100 | #102 | Exceptional 29.5% |
| Lebanese | 94.4 /100 | #103 | Exceptional 29.5% |
| Lithuanians | 94.4 /100 | #104 | Exceptional 29.6% |
| Immigrants | Nepal | 94.3 /100 | #105 | Exceptional 29.6% |
| Swedes | 93.8 /100 | #106 | Exceptional 29.6% |
| Immigrants | Brazil | 93.7 /100 | #107 | Exceptional 29.6% |
| Paraguayans | 93.5 /100 | #108 | Exceptional 29.7% |
| Greeks | 93.4 /100 | #109 | Exceptional 29.7% |
| Immigrants | Ethiopia | 93.4 /100 | #110 | Exceptional 29.7% |
| Immigrants | Hungary | 93.0 /100 | #111 | Exceptional 29.7% |
| Basques | 93.0 /100 | #112 | Exceptional 29.7% |
| Scandinavians | 92.7 /100 | #113 | Exceptional 29.8% |
| Immigrants | Croatia | 92.6 /100 | #114 | Exceptional 29.8% |
| Ethiopians | 91.9 /100 | #115 | Exceptional 29.8% |
| Immigrants | Italy | 91.7 /100 | #116 | Exceptional 29.9% |
| Immigrants | Netherlands | 91.1 /100 | #117 | Exceptional 29.9% |
| Immigrants | Norway | 91.0 /100 | #118 | Exceptional 29.9% |
| Argentineans | 90.5 /100 | #119 | Exceptional 30.0% |
| Ugandans | 89.2 /100 | #120 | Excellent 30.1% |
| Koreans | 88.9 /100 | #121 | Excellent 30.1% |