Immigrants from North Macedonia vs Immigrants from Jamaica Average Family Size
COMPARE
Immigrants from North Macedonia
Immigrants from Jamaica
Average Family Size
Average Family Size Comparison
Immigrants from North Macedonia
Immigrants from Jamaica
3.16
AVERAGE FAMILY SIZE
1.3/ 100
METRIC RATING
261st/ 347
METRIC RANK
3.33
AVERAGE FAMILY SIZE
99.9/ 100
METRIC RATING
67th/ 347
METRIC RANK
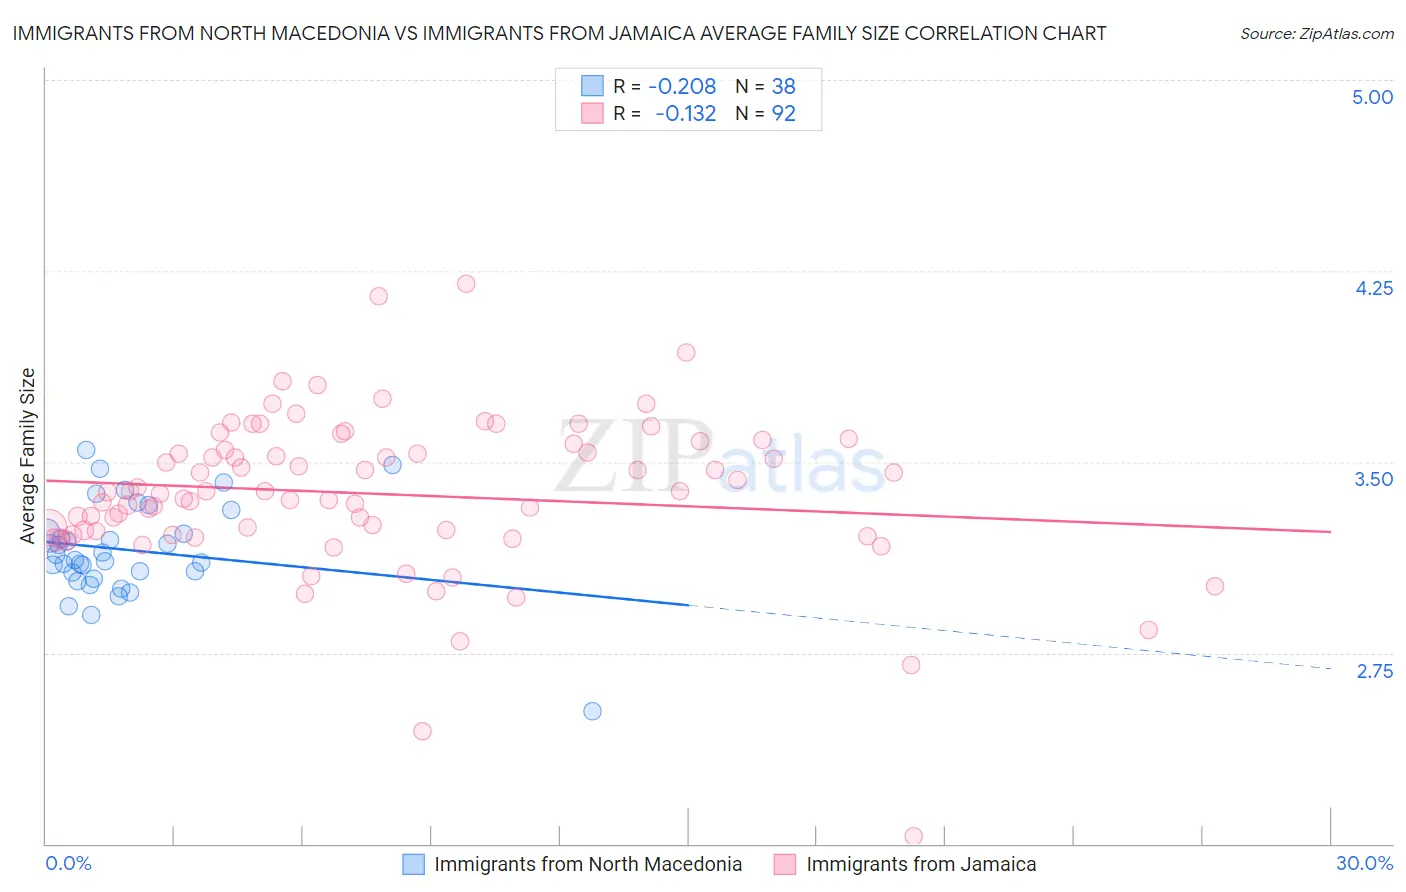
Immigrants from North Macedonia vs Immigrants from Jamaica Average Family Size Correlation Chart
The statistical analysis conducted on geographies consisting of 74,306,697 people shows a weak negative correlation between the proportion of Immigrants from North Macedonia and average family size in the United States with a correlation coefficient (R) of -0.208 and weighted average of 3.16. Similarly, the statistical analysis conducted on geographies consisting of 301,591,194 people shows a poor negative correlation between the proportion of Immigrants from Jamaica and average family size in the United States with a correlation coefficient (R) of -0.132 and weighted average of 3.33, a difference of 5.4%.
Average Family Size Correlation Summary
| Measurement | Immigrants from North Macedonia | Immigrants from Jamaica |
| Minimum | 2.52 | 2.03 |
| Maximum | 3.55 | 4.20 |
| Range | 1.03 | 2.17 |
| Mean | 3.15 | 3.37 |
| Median | 3.13 | 3.38 |
| Interquartile 25% (IQ1) | 3.07 | 3.22 |
| Interquartile 75% (IQ3) | 3.23 | 3.56 |
| Interquartile Range (IQR) | 0.16 | 0.34 |
| Standard Deviation (Sample) | 0.19 | 0.31 |
| Standard Deviation (Population) | 0.19 | 0.31 |
Similar Demographics by Average Family Size
Demographics Similar to Immigrants from North Macedonia by Average Family Size
In terms of average family size, the demographic groups most similar to Immigrants from North Macedonia are Turkish (3.16, a difference of 0.010%), Potawatomi (3.16, a difference of 0.010%), Immigrants from Albania (3.16, a difference of 0.010%), Immigrants from Russia (3.16, a difference of 0.010%), and Albanian (3.17, a difference of 0.060%).
| Demographics | Rating | Rank | Average Family Size |
| Immigrants | Hungary | 1.7 /100 | #254 | Tragic 3.17 |
| Cape Verdeans | 1.6 /100 | #255 | Tragic 3.17 |
| Immigrants | Kazakhstan | 1.5 /100 | #256 | Tragic 3.17 |
| Albanians | 1.5 /100 | #257 | Tragic 3.17 |
| Turks | 1.3 /100 | #258 | Tragic 3.16 |
| Potawatomi | 1.3 /100 | #259 | Tragic 3.16 |
| Immigrants | Albania | 1.3 /100 | #260 | Tragic 3.16 |
| Immigrants | North Macedonia | 1.3 /100 | #261 | Tragic 3.16 |
| Immigrants | Russia | 1.3 /100 | #262 | Tragic 3.16 |
| Immigrants | Bulgaria | 1.0 /100 | #263 | Tragic 3.16 |
| Americans | 1.0 /100 | #264 | Tragic 3.16 |
| Immigrants | South Africa | 0.9 /100 | #265 | Tragic 3.16 |
| Immigrants | Greece | 0.9 /100 | #266 | Tragic 3.16 |
| Iroquois | 0.8 /100 | #267 | Tragic 3.16 |
| Maltese | 0.8 /100 | #268 | Tragic 3.16 |
Demographics Similar to Immigrants from Jamaica by Average Family Size
In terms of average family size, the demographic groups most similar to Immigrants from Jamaica are Immigrants from St. Vincent and the Grenadines (3.34, a difference of 0.040%), Immigrants from Cambodia (3.33, a difference of 0.080%), Immigrants from Laos (3.34, a difference of 0.10%), Immigrants (3.33, a difference of 0.11%), and Dominican (3.34, a difference of 0.12%).
| Demographics | Rating | Rank | Average Family Size |
| Immigrants | Armenia | 100.0 /100 | #60 | Exceptional 3.35 |
| Central American Indians | 100.0 /100 | #61 | Exceptional 3.35 |
| Immigrants | Grenada | 100.0 /100 | #62 | Exceptional 3.34 |
| Chinese | 100.0 /100 | #63 | Exceptional 3.34 |
| Dominicans | 99.9 /100 | #64 | Exceptional 3.34 |
| Immigrants | Laos | 99.9 /100 | #65 | Exceptional 3.34 |
| Immigrants | St. Vincent and the Grenadines | 99.9 /100 | #66 | Exceptional 3.34 |
| Immigrants | Jamaica | 99.9 /100 | #67 | Exceptional 3.33 |
| Immigrants | Cambodia | 99.9 /100 | #68 | Exceptional 3.33 |
| Immigrants | Immigrants | 99.9 /100 | #69 | Exceptional 3.33 |
| Immigrants | Trinidad and Tobago | 99.9 /100 | #70 | Exceptional 3.33 |
| Immigrants | West Indies | 99.9 /100 | #71 | Exceptional 3.33 |
| Immigrants | Caribbean | 99.9 /100 | #72 | Exceptional 3.33 |
| Yaqui | 99.9 /100 | #73 | Exceptional 3.32 |
| Immigrants | Sierra Leone | 99.9 /100 | #74 | Exceptional 3.32 |