Immigrants from North Macedonia vs Swiss In Labor Force | Age 20-24
COMPARE
Immigrants from North Macedonia
Swiss
In Labor Force | Age 20-24
In Labor Force | Age 20-24 Comparison
Immigrants from North Macedonia
Swiss
76.1%
IN LABOR FORCE | AGE 20-24
97.5/ 100
METRIC RATING
103rd/ 347
METRIC RANK
77.7%
IN LABOR FORCE | AGE 20-24
100.0/ 100
METRIC RATING
30th/ 347
METRIC RANK
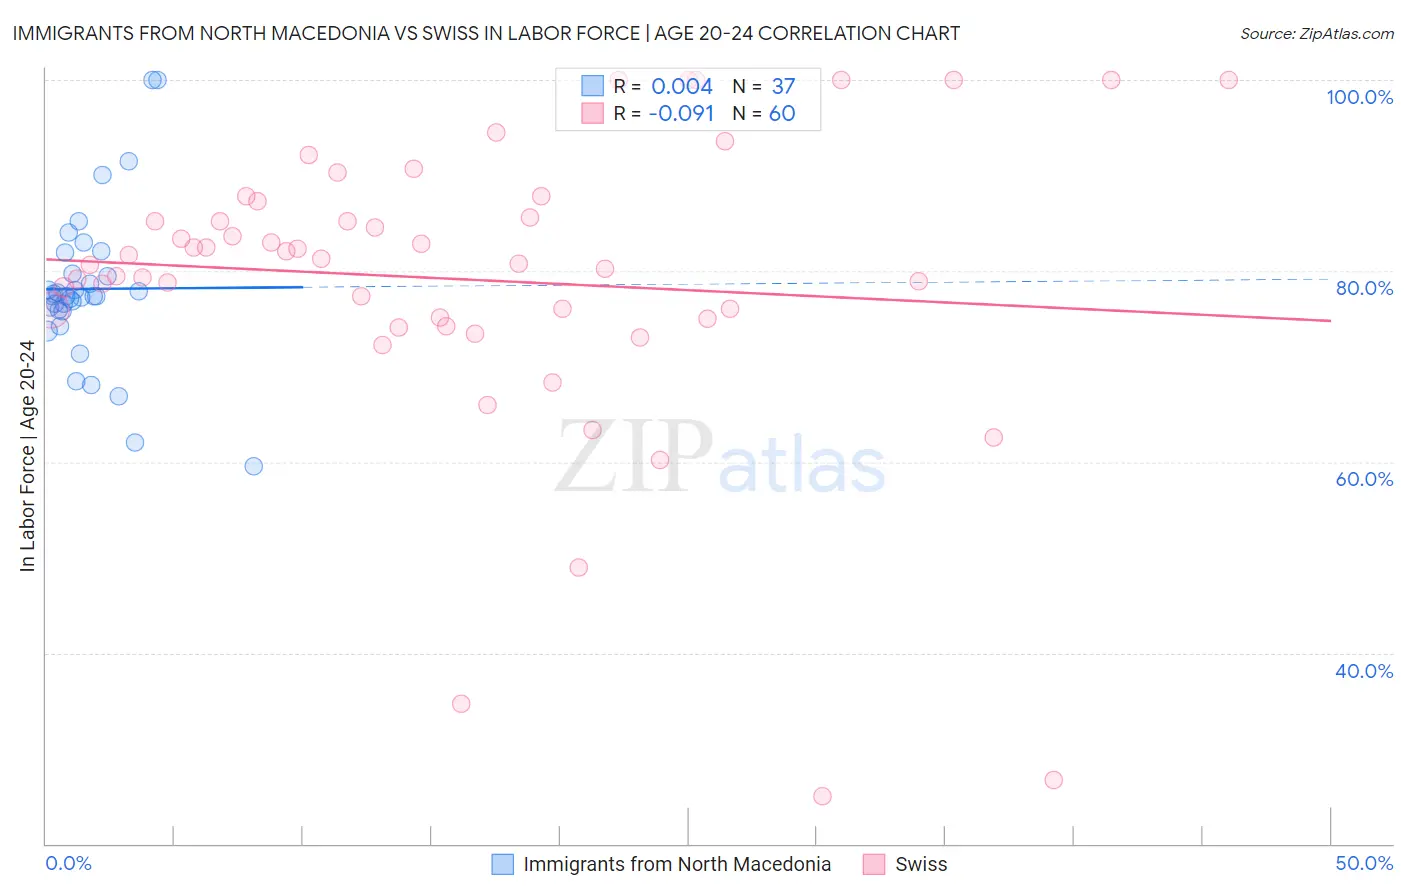
Immigrants from North Macedonia vs Swiss In Labor Force | Age 20-24 Correlation Chart
The statistical analysis conducted on geographies consisting of 74,315,577 people shows no correlation between the proportion of Immigrants from North Macedonia and labor force participation rate among population between the ages 20 and 24 in the United States with a correlation coefficient (R) of 0.004 and weighted average of 76.1%. Similarly, the statistical analysis conducted on geographies consisting of 464,562,174 people shows a slight negative correlation between the proportion of Swiss and labor force participation rate among population between the ages 20 and 24 in the United States with a correlation coefficient (R) of -0.091 and weighted average of 77.7%, a difference of 2.2%.
In Labor Force | Age 20-24 Correlation Summary
| Measurement | Immigrants from North Macedonia | Swiss |
| Minimum | 59.5% | 25.0% |
| Maximum | 100.0% | 100.0% |
| Range | 40.5% | 75.0% |
| Mean | 78.1% | 79.1% |
| Median | 77.4% | 81.0% |
| Interquartile 25% (IQ1) | 75.8% | 75.0% |
| Interquartile 75% (IQ3) | 80.8% | 86.5% |
| Interquartile Range (IQR) | 5.0% | 11.4% |
| Standard Deviation (Sample) | 8.3% | 15.6% |
| Standard Deviation (Population) | 8.1% | 15.5% |
Similar Demographics by In Labor Force | Age 20-24
Demographics Similar to Immigrants from North Macedonia by In Labor Force | Age 20-24
In terms of in labor force | age 20-24, the demographic groups most similar to Immigrants from North Macedonia are Latvian (76.1%, a difference of 0.020%), Immigrants from Poland (76.1%, a difference of 0.030%), Shoshone (76.1%, a difference of 0.040%), Macedonian (76.0%, a difference of 0.040%), and Immigrants from Nepal (76.0%, a difference of 0.040%).
| Demographics | Rating | Rank | In Labor Force | Age 20-24 |
| Immigrants | Nonimmigrants | 98.5 /100 | #96 | Exceptional 76.2% |
| Immigrants | Lithuania | 98.0 /100 | #97 | Exceptional 76.1% |
| Immigrants | Oceania | 98.0 /100 | #98 | Exceptional 76.1% |
| Americans | 97.8 /100 | #99 | Exceptional 76.1% |
| Shoshone | 97.8 /100 | #100 | Exceptional 76.1% |
| Immigrants | Poland | 97.7 /100 | #101 | Exceptional 76.1% |
| Latvians | 97.6 /100 | #102 | Exceptional 76.1% |
| Immigrants | North Macedonia | 97.5 /100 | #103 | Exceptional 76.1% |
| Macedonians | 97.2 /100 | #104 | Exceptional 76.0% |
| Immigrants | Nepal | 97.2 /100 | #105 | Exceptional 76.0% |
| Immigrants | Uganda | 97.1 /100 | #106 | Exceptional 76.0% |
| Greeks | 96.9 /100 | #107 | Exceptional 76.0% |
| Iraqis | 96.6 /100 | #108 | Exceptional 76.0% |
| Cherokee | 95.8 /100 | #109 | Exceptional 75.9% |
| Immigrants | Morocco | 95.8 /100 | #110 | Exceptional 75.9% |
Demographics Similar to Swiss by In Labor Force | Age 20-24
In terms of in labor force | age 20-24, the demographic groups most similar to Swiss are Slovak (77.7%, a difference of 0.020%), Belgian (77.8%, a difference of 0.10%), Polish (77.6%, a difference of 0.12%), Immigrants from Micronesia (77.8%, a difference of 0.14%), and English (77.6%, a difference of 0.18%).
| Demographics | Rating | Rank | In Labor Force | Age 20-24 |
| Yugoslavians | 100.0 /100 | #23 | Exceptional 78.0% |
| Liberians | 100.0 /100 | #24 | Exceptional 78.0% |
| Tlingit-Haida | 100.0 /100 | #25 | Exceptional 77.9% |
| Tongans | 100.0 /100 | #26 | Exceptional 77.9% |
| Immigrants | Micronesia | 100.0 /100 | #27 | Exceptional 77.8% |
| Belgians | 100.0 /100 | #28 | Exceptional 77.8% |
| Slovaks | 100.0 /100 | #29 | Exceptional 77.7% |
| Swiss | 100.0 /100 | #30 | Exceptional 77.7% |
| Poles | 100.0 /100 | #31 | Exceptional 77.6% |
| English | 100.0 /100 | #32 | Exceptional 77.6% |
| Immigrants | Ethiopia | 100.0 /100 | #33 | Exceptional 77.5% |
| German Russians | 100.0 /100 | #34 | Exceptional 77.5% |
| Immigrants | Eastern Africa | 100.0 /100 | #35 | Exceptional 77.5% |
| Welsh | 100.0 /100 | #36 | Exceptional 77.5% |
| Czechoslovakians | 100.0 /100 | #37 | Exceptional 77.5% |