Immigrants from North America vs Spanish Births to Unmarried Women
COMPARE
Immigrants from North America
Spanish
Births to Unmarried Women
Births to Unmarried Women Comparison
Immigrants from North America
Spanish
30.6%
BIRTHS TO UNMARRIED WOMEN
81.5/ 100
METRIC RATING
145th/ 347
METRIC RANK
34.1%
BIRTHS TO UNMARRIED WOMEN
4.0/ 100
METRIC RATING
225th/ 347
METRIC RANK
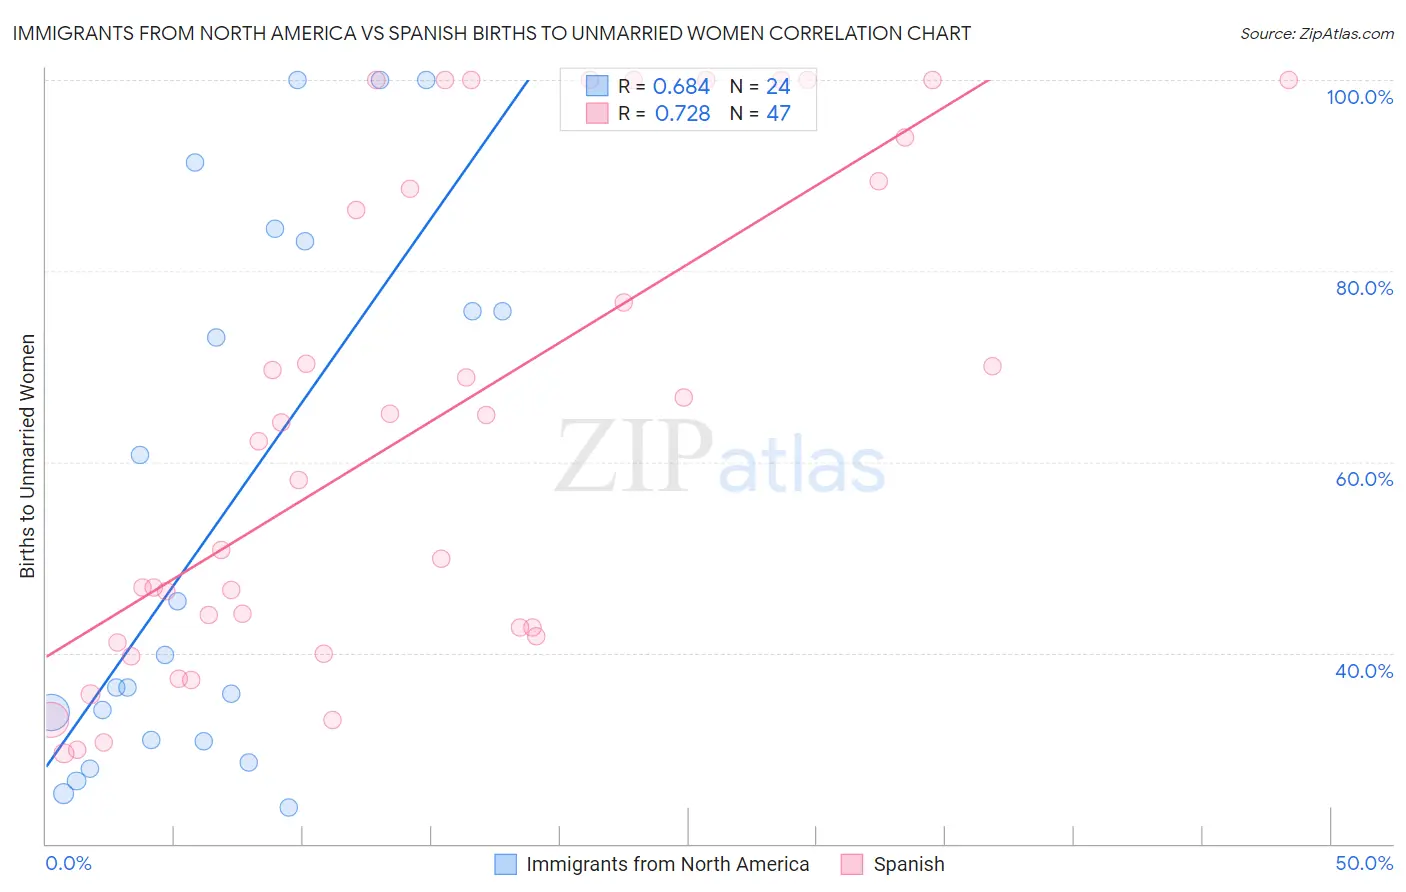
Immigrants from North America vs Spanish Births to Unmarried Women Correlation Chart
The statistical analysis conducted on geographies consisting of 422,623,655 people shows a significant positive correlation between the proportion of Immigrants from North America and percentage of births to unmarried women in the United States with a correlation coefficient (R) of 0.684 and weighted average of 30.6%. Similarly, the statistical analysis conducted on geographies consisting of 393,000,764 people shows a strong positive correlation between the proportion of Spanish and percentage of births to unmarried women in the United States with a correlation coefficient (R) of 0.728 and weighted average of 34.1%, a difference of 11.5%.
Births to Unmarried Women Correlation Summary
| Measurement | Immigrants from North America | Spanish |
| Minimum | 23.8% | 29.5% |
| Maximum | 100.0% | 100.0% |
| Range | 76.2% | 70.5% |
| Mean | 54.1% | 63.5% |
| Median | 38.1% | 62.2% |
| Interquartile 25% (IQ1) | 30.8% | 41.7% |
| Interquartile 75% (IQ3) | 79.4% | 89.4% |
| Interquartile Range (IQR) | 48.7% | 47.7% |
| Standard Deviation (Sample) | 27.8% | 25.1% |
| Standard Deviation (Population) | 27.2% | 24.9% |
Similar Demographics by Births to Unmarried Women
Demographics Similar to Immigrants from North America by Births to Unmarried Women
In terms of births to unmarried women, the demographic groups most similar to Immigrants from North America are Northern European (30.6%, a difference of 0.030%), Immigrants from Oceania (30.6%, a difference of 0.050%), Czech (30.5%, a difference of 0.10%), Immigrants from Uganda (30.5%, a difference of 0.17%), and South African (30.5%, a difference of 0.19%).
| Demographics | Rating | Rank | Births to Unmarried Women |
| Puget Sound Salish | 83.9 /100 | #138 | Excellent 30.4% |
| Immigrants | Canada | 83.7 /100 | #139 | Excellent 30.4% |
| Swiss | 83.1 /100 | #140 | Excellent 30.5% |
| Pakistanis | 83.0 /100 | #141 | Excellent 30.5% |
| South Africans | 82.7 /100 | #142 | Excellent 30.5% |
| Immigrants | Uganda | 82.6 /100 | #143 | Excellent 30.5% |
| Czechs | 82.1 /100 | #144 | Excellent 30.5% |
| Immigrants | North America | 81.5 /100 | #145 | Excellent 30.6% |
| Northern Europeans | 81.4 /100 | #146 | Excellent 30.6% |
| Immigrants | Oceania | 81.2 /100 | #147 | Excellent 30.6% |
| Chileans | 79.1 /100 | #148 | Good 30.7% |
| Serbians | 78.8 /100 | #149 | Good 30.7% |
| Somalis | 77.8 /100 | #150 | Good 30.7% |
| Italians | 77.0 /100 | #151 | Good 30.8% |
| Poles | 76.2 /100 | #152 | Good 30.8% |
Demographics Similar to Spanish by Births to Unmarried Women
In terms of births to unmarried women, the demographic groups most similar to Spanish are Immigrants from Laos (34.0%, a difference of 0.16%), Pennsylvania German (34.0%, a difference of 0.17%), Delaware (34.2%, a difference of 0.39%), Immigrants from Panama (34.2%, a difference of 0.41%), and Panamanian (34.2%, a difference of 0.44%).
| Demographics | Rating | Rank | Births to Unmarried Women |
| Immigrants | Ecuador | 5.9 /100 | #218 | Tragic 33.7% |
| Alsatians | 5.4 /100 | #219 | Tragic 33.8% |
| Portuguese | 5.4 /100 | #220 | Tragic 33.8% |
| Malaysians | 5.0 /100 | #221 | Tragic 33.9% |
| Immigrants | Uruguay | 4.8 /100 | #222 | Tragic 33.9% |
| Pennsylvania Germans | 4.3 /100 | #223 | Tragic 34.0% |
| Immigrants | Laos | 4.3 /100 | #224 | Tragic 34.0% |
| Spanish | 4.0 /100 | #225 | Tragic 34.1% |
| Delaware | 3.3 /100 | #226 | Tragic 34.2% |
| Immigrants | Panama | 3.3 /100 | #227 | Tragic 34.2% |
| Panamanians | 3.3 /100 | #228 | Tragic 34.2% |
| Immigrants | Sierra Leone | 3.1 /100 | #229 | Tragic 34.2% |
| Ghanaians | 3.1 /100 | #230 | Tragic 34.3% |
| Native Hawaiians | 2.9 /100 | #231 | Tragic 34.3% |
| French Canadians | 2.5 /100 | #232 | Tragic 34.4% |