Immigrants from England vs Eastern European Married-couple Households
COMPARE
Immigrants from England
Eastern European
Married-couple Households
Married-couple Households Comparison
Immigrants from England
Eastern Europeans
48.2%
MARRIED-COUPLE HOUSEHOLDS
98.4/ 100
METRIC RATING
75th/ 347
METRIC RANK
48.6%
MARRIED-COUPLE HOUSEHOLDS
99.3/ 100
METRIC RATING
51st/ 347
METRIC RANK
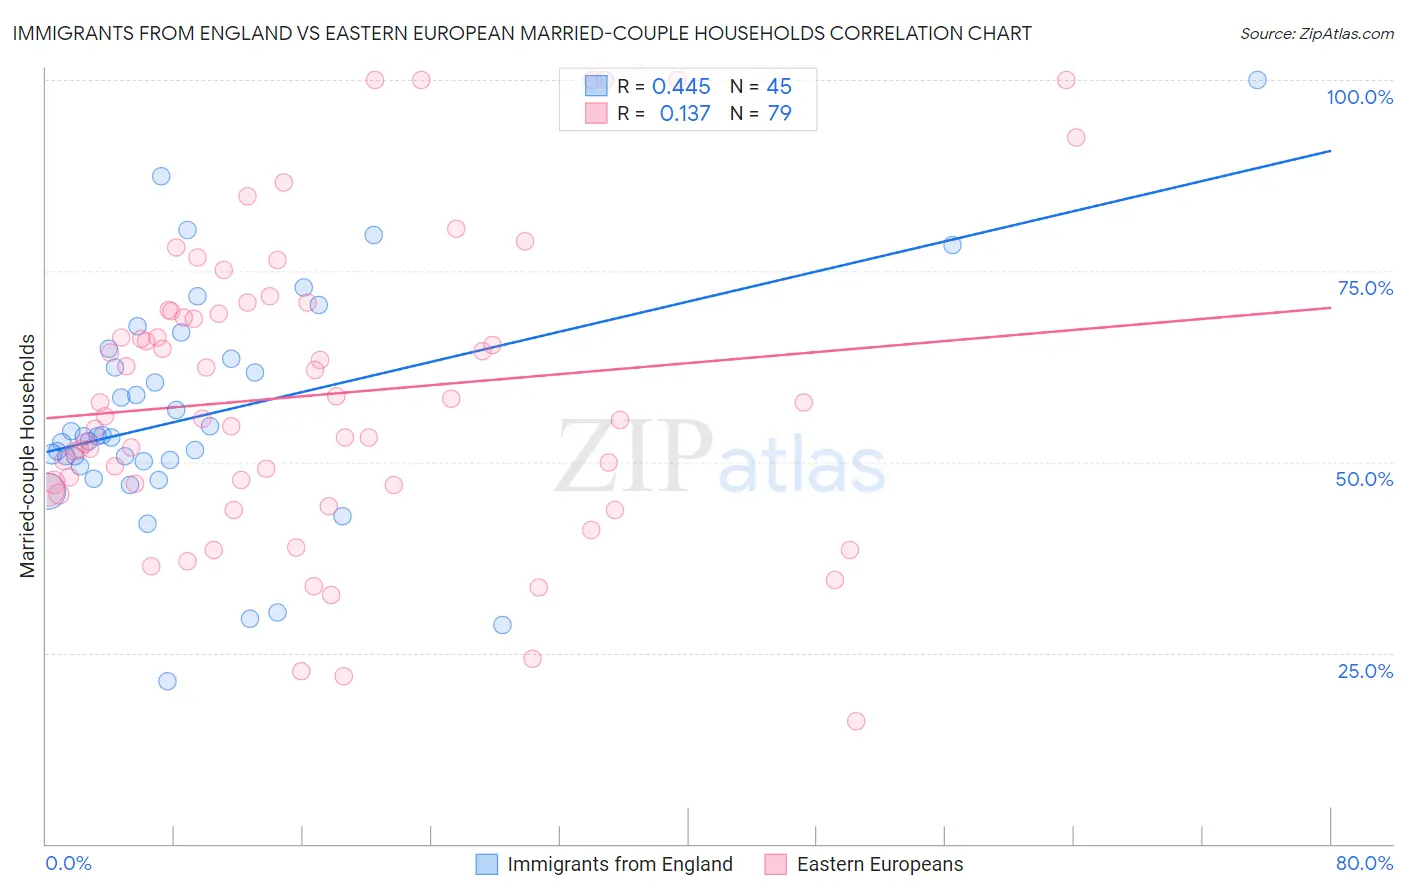
Immigrants from England vs Eastern European Married-couple Households Correlation Chart
The statistical analysis conducted on geographies consisting of 391,752,954 people shows a moderate positive correlation between the proportion of Immigrants from England and percentage of married-couple family households in the United States with a correlation coefficient (R) of 0.445 and weighted average of 48.2%. Similarly, the statistical analysis conducted on geographies consisting of 460,944,660 people shows a poor positive correlation between the proportion of Eastern Europeans and percentage of married-couple family households in the United States with a correlation coefficient (R) of 0.137 and weighted average of 48.6%, a difference of 0.82%.
Married-couple Households Correlation Summary
| Measurement | Immigrants from England | Eastern European |
| Minimum | 21.3% | 16.0% |
| Maximum | 100.0% | 100.0% |
| Range | 78.7% | 84.0% |
| Mean | 56.2% | 58.8% |
| Median | 53.4% | 55.9% |
| Interquartile 25% (IQ1) | 49.8% | 47.0% |
| Interquartile 75% (IQ3) | 64.2% | 69.8% |
| Interquartile Range (IQR) | 14.4% | 22.8% |
| Standard Deviation (Sample) | 15.2% | 19.4% |
| Standard Deviation (Population) | 15.0% | 19.3% |
Similar Demographics by Married-couple Households
Demographics Similar to Immigrants from England by Married-couple Households
In terms of married-couple households, the demographic groups most similar to Immigrants from England are Immigrants from Fiji (48.2%, a difference of 0.0%), Immigrants from Romania (48.3%, a difference of 0.090%), Immigrants from Singapore (48.3%, a difference of 0.10%), Canadian (48.2%, a difference of 0.10%), and Scotch-Irish (48.3%, a difference of 0.12%).
| Demographics | Rating | Rank | Married-couple Households |
| Immigrants | South Eastern Asia | 98.9 /100 | #68 | Exceptional 48.4% |
| Immigrants | China | 98.9 /100 | #69 | Exceptional 48.4% |
| Immigrants | North America | 98.9 /100 | #70 | Exceptional 48.4% |
| Laotians | 98.8 /100 | #71 | Exceptional 48.4% |
| Scotch-Irish | 98.6 /100 | #72 | Exceptional 48.3% |
| Immigrants | Singapore | 98.6 /100 | #73 | Exceptional 48.3% |
| Immigrants | Romania | 98.6 /100 | #74 | Exceptional 48.3% |
| Immigrants | England | 98.4 /100 | #75 | Exceptional 48.2% |
| Immigrants | Fiji | 98.4 /100 | #76 | Exceptional 48.2% |
| Canadians | 98.2 /100 | #77 | Exceptional 48.2% |
| Egyptians | 98.2 /100 | #78 | Exceptional 48.2% |
| Immigrants | Netherlands | 98.2 /100 | #79 | Exceptional 48.2% |
| Russians | 98.1 /100 | #80 | Exceptional 48.2% |
| Finns | 98.0 /100 | #81 | Exceptional 48.1% |
| Immigrants | Poland | 97.7 /100 | #82 | Exceptional 48.1% |
Demographics Similar to Eastern Europeans by Married-couple Households
In terms of married-couple households, the demographic groups most similar to Eastern Europeans are Samoan (48.7%, a difference of 0.040%), Irish (48.6%, a difference of 0.040%), Immigrants from Sri Lanka (48.7%, a difference of 0.080%), White/Caucasian (48.6%, a difference of 0.090%), and Immigrants from Lithuania (48.6%, a difference of 0.090%).
| Demographics | Rating | Rank | Married-couple Households |
| Welsh | 99.5 /100 | #44 | Exceptional 48.8% |
| Immigrants | Eastern Asia | 99.5 /100 | #45 | Exceptional 48.8% |
| Tsimshian | 99.5 /100 | #46 | Exceptional 48.7% |
| British | 99.5 /100 | #47 | Exceptional 48.7% |
| Indians (Asian) | 99.4 /100 | #48 | Exceptional 48.7% |
| Immigrants | Sri Lanka | 99.4 /100 | #49 | Exceptional 48.7% |
| Samoans | 99.4 /100 | #50 | Exceptional 48.7% |
| Eastern Europeans | 99.3 /100 | #51 | Exceptional 48.6% |
| Irish | 99.3 /100 | #52 | Exceptional 48.6% |
| Whites/Caucasians | 99.3 /100 | #53 | Exceptional 48.6% |
| Immigrants | Lithuania | 99.3 /100 | #54 | Exceptional 48.6% |
| Austrians | 99.3 /100 | #55 | Exceptional 48.6% |
| Immigrants | Northern Europe | 99.3 /100 | #56 | Exceptional 48.6% |
| Poles | 99.2 /100 | #57 | Exceptional 48.5% |
| Immigrants | Indonesia | 99.2 /100 | #58 | Exceptional 48.5% |