Immigrants from Nigeria vs Immigrants from Bangladesh Currently Married
COMPARE
Immigrants from Nigeria
Immigrants from Bangladesh
Currently Married
Currently Married Comparison
Immigrants from Nigeria
Immigrants from Bangladesh
43.4%
CURRENTLY MARRIED
0.1/ 100
METRIC RATING
277th/ 347
METRIC RANK
43.6%
CURRENTLY MARRIED
0.1/ 100
METRIC RATING
265th/ 347
METRIC RANK
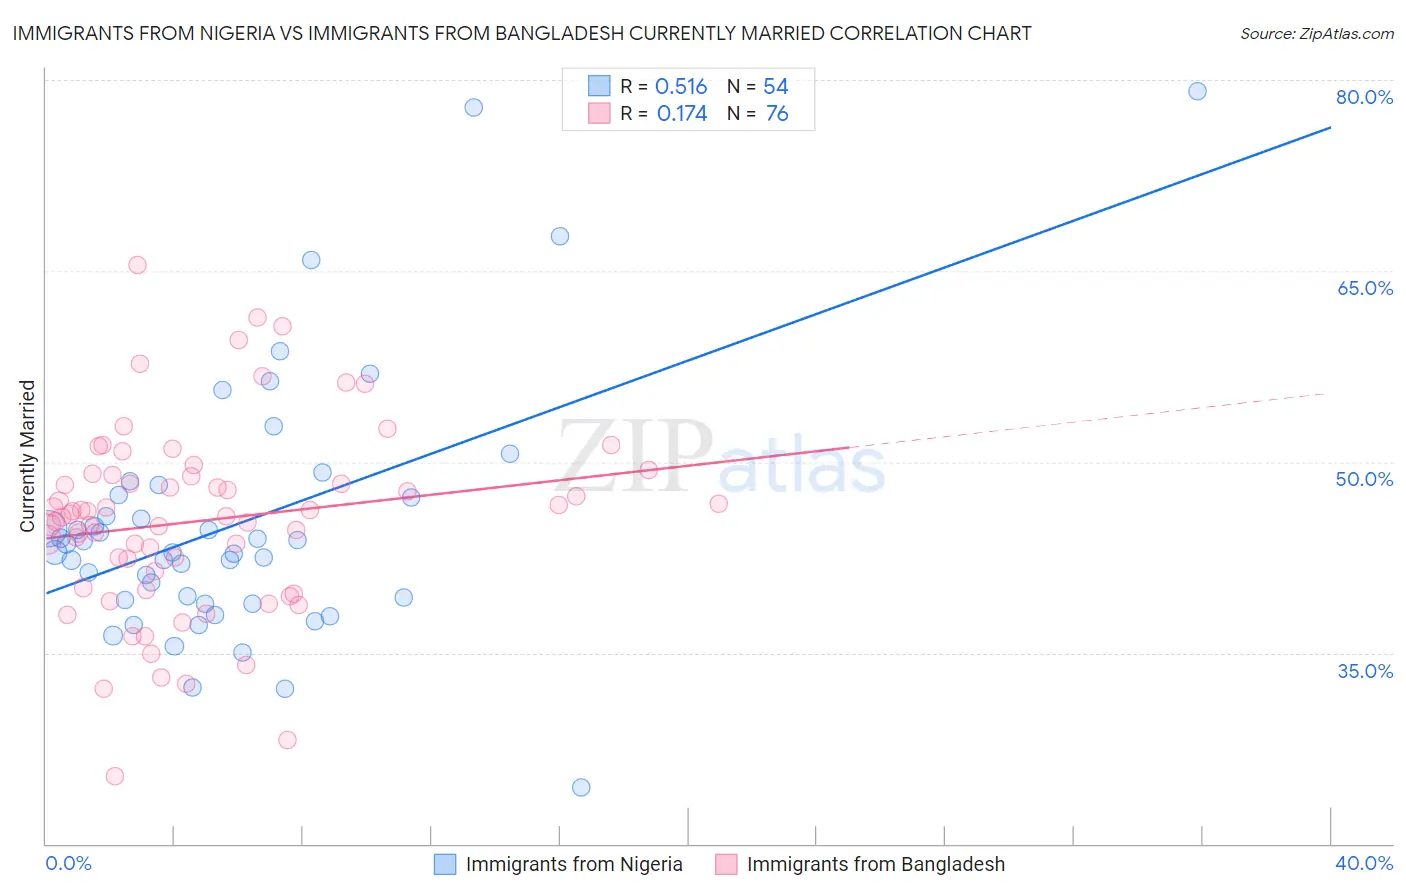
Immigrants from Nigeria vs Immigrants from Bangladesh Currently Married Correlation Chart
The statistical analysis conducted on geographies consisting of 283,441,157 people shows a substantial positive correlation between the proportion of Immigrants from Nigeria and percentage of population currently married in the United States with a correlation coefficient (R) of 0.516 and weighted average of 43.4%. Similarly, the statistical analysis conducted on geographies consisting of 203,666,210 people shows a poor positive correlation between the proportion of Immigrants from Bangladesh and percentage of population currently married in the United States with a correlation coefficient (R) of 0.174 and weighted average of 43.6%, a difference of 0.47%.
Currently Married Correlation Summary
| Measurement | Immigrants from Nigeria | Immigrants from Bangladesh |
| Minimum | 24.4% | 25.3% |
| Maximum | 79.1% | 65.5% |
| Range | 54.7% | 40.2% |
| Mean | 45.1% | 45.4% |
| Median | 43.2% | 45.8% |
| Interquartile 25% (IQ1) | 39.2% | 40.7% |
| Interquartile 75% (IQ3) | 47.4% | 48.9% |
| Interquartile Range (IQR) | 8.3% | 8.2% |
| Standard Deviation (Sample) | 10.2% | 7.4% |
| Standard Deviation (Population) | 10.1% | 7.3% |
Demographics Similar to Immigrants from Nigeria and Immigrants from Bangladesh by Currently Married
In terms of currently married, the demographic groups most similar to Immigrants from Nigeria are Sierra Leonean (43.4%, a difference of 0.010%), Colville (43.4%, a difference of 0.040%), Nigerian (43.4%, a difference of 0.060%), Yaqui (43.4%, a difference of 0.070%), and Indonesian (43.5%, a difference of 0.12%). Similarly, the demographic groups most similar to Immigrants from Bangladesh are Ecuadorian (43.6%, a difference of 0.070%), Sudanese (43.7%, a difference of 0.080%), Immigrants from Cuba (43.7%, a difference of 0.10%), Immigrants from Eritrea (43.6%, a difference of 0.10%), and Spanish American Indian (43.6%, a difference of 0.10%).
| Demographics | Rating | Rank | Currently Married |
| Immigrants | Nicaragua | 0.1 /100 | #261 | Tragic 43.7% |
| Bangladeshis | 0.1 /100 | #262 | Tragic 43.7% |
| Immigrants | Cuba | 0.1 /100 | #263 | Tragic 43.7% |
| Sudanese | 0.1 /100 | #264 | Tragic 43.7% |
| Immigrants | Bangladesh | 0.1 /100 | #265 | Tragic 43.6% |
| Ecuadorians | 0.1 /100 | #266 | Tragic 43.6% |
| Immigrants | Eritrea | 0.1 /100 | #267 | Tragic 43.6% |
| Spanish American Indians | 0.1 /100 | #268 | Tragic 43.6% |
| Immigrants | Sudan | 0.1 /100 | #269 | Tragic 43.5% |
| Salvadorans | 0.1 /100 | #270 | Tragic 43.5% |
| Bermudans | 0.1 /100 | #271 | Tragic 43.5% |
| Indonesians | 0.1 /100 | #272 | Tragic 43.5% |
| Yaqui | 0.1 /100 | #273 | Tragic 43.4% |
| Nigerians | 0.1 /100 | #274 | Tragic 43.4% |
| Colville | 0.1 /100 | #275 | Tragic 43.4% |
| Sierra Leoneans | 0.1 /100 | #276 | Tragic 43.4% |
| Immigrants | Nigeria | 0.1 /100 | #277 | Tragic 43.4% |
| Central Americans | 0.0 /100 | #278 | Tragic 43.3% |
| Central American Indians | 0.0 /100 | #279 | Tragic 43.3% |
| Apache | 0.0 /100 | #280 | Tragic 43.2% |
| Chippewa | 0.0 /100 | #281 | Tragic 43.2% |