Immigrants from Nigeria vs German Currently Married
COMPARE
Immigrants from Nigeria
German
Currently Married
Currently Married Comparison
Immigrants from Nigeria
Germans
43.4%
CURRENTLY MARRIED
0.1/ 100
METRIC RATING
277th/ 347
METRIC RANK
49.6%
CURRENTLY MARRIED
99.9/ 100
METRIC RATING
14th/ 347
METRIC RANK
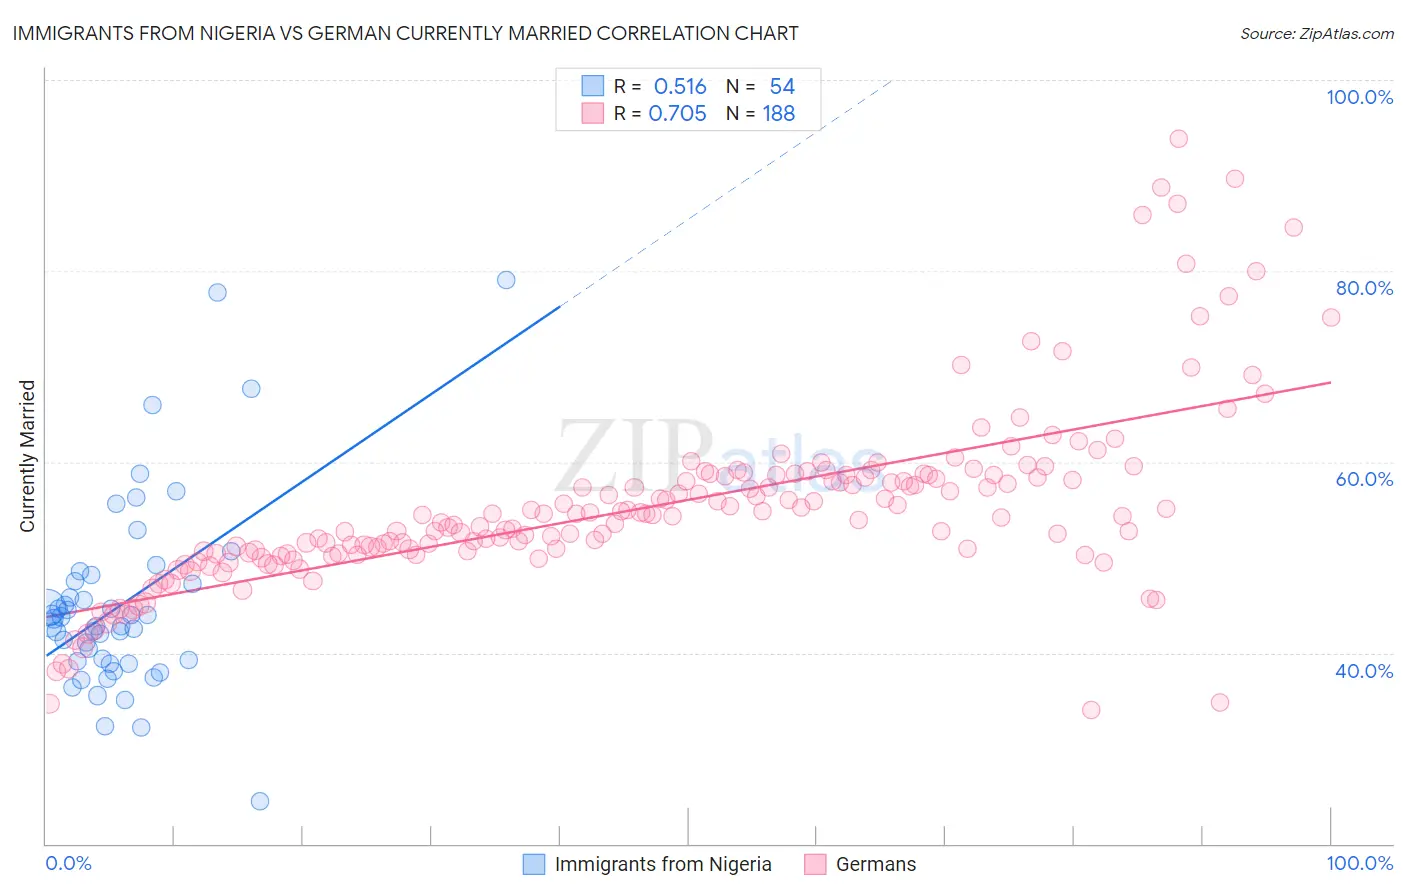
Immigrants from Nigeria vs German Currently Married Correlation Chart
The statistical analysis conducted on geographies consisting of 283,441,157 people shows a substantial positive correlation between the proportion of Immigrants from Nigeria and percentage of population currently married in the United States with a correlation coefficient (R) of 0.516 and weighted average of 43.4%. Similarly, the statistical analysis conducted on geographies consisting of 581,146,100 people shows a strong positive correlation between the proportion of Germans and percentage of population currently married in the United States with a correlation coefficient (R) of 0.705 and weighted average of 49.6%, a difference of 14.2%.
Currently Married Correlation Summary
| Measurement | Immigrants from Nigeria | German |
| Minimum | 24.4% | 34.0% |
| Maximum | 79.1% | 93.9% |
| Range | 54.7% | 59.9% |
| Mean | 45.1% | 55.3% |
| Median | 43.2% | 54.4% |
| Interquartile 25% (IQ1) | 39.2% | 50.4% |
| Interquartile 75% (IQ3) | 47.4% | 58.5% |
| Interquartile Range (IQR) | 8.3% | 8.2% |
| Standard Deviation (Sample) | 10.2% | 9.6% |
| Standard Deviation (Population) | 10.1% | 9.5% |
Similar Demographics by Currently Married
Demographics Similar to Immigrants from Nigeria by Currently Married
In terms of currently married, the demographic groups most similar to Immigrants from Nigeria are Sierra Leonean (43.4%, a difference of 0.010%), Colville (43.4%, a difference of 0.040%), Nigerian (43.4%, a difference of 0.060%), Yaqui (43.4%, a difference of 0.070%), and Indonesian (43.5%, a difference of 0.12%).
| Demographics | Rating | Rank | Currently Married |
| Salvadorans | 0.1 /100 | #270 | Tragic 43.5% |
| Bermudans | 0.1 /100 | #271 | Tragic 43.5% |
| Indonesians | 0.1 /100 | #272 | Tragic 43.5% |
| Yaqui | 0.1 /100 | #273 | Tragic 43.4% |
| Nigerians | 0.1 /100 | #274 | Tragic 43.4% |
| Colville | 0.1 /100 | #275 | Tragic 43.4% |
| Sierra Leoneans | 0.1 /100 | #276 | Tragic 43.4% |
| Immigrants | Nigeria | 0.1 /100 | #277 | Tragic 43.4% |
| Central Americans | 0.0 /100 | #278 | Tragic 43.3% |
| Central American Indians | 0.0 /100 | #279 | Tragic 43.3% |
| Apache | 0.0 /100 | #280 | Tragic 43.2% |
| Chippewa | 0.0 /100 | #281 | Tragic 43.2% |
| Immigrants | Ecuador | 0.0 /100 | #282 | Tragic 43.2% |
| Kiowa | 0.0 /100 | #283 | Tragic 43.2% |
| Immigrants | El Salvador | 0.0 /100 | #284 | Tragic 43.1% |
Demographics Similar to Germans by Currently Married
In terms of currently married, the demographic groups most similar to Germans are Dutch (49.6%, a difference of 0.010%), Pennsylvania German (49.6%, a difference of 0.030%), Chinese (49.5%, a difference of 0.17%), Scandinavian (49.5%, a difference of 0.19%), and English (49.7%, a difference of 0.28%).
| Demographics | Rating | Rank | Currently Married |
| Immigrants | South Central Asia | 100.0 /100 | #7 | Exceptional 50.0% |
| Swedes | 100.0 /100 | #8 | Exceptional 50.0% |
| Czechs | 99.9 /100 | #9 | Exceptional 49.9% |
| Filipinos | 99.9 /100 | #10 | Exceptional 49.7% |
| English | 99.9 /100 | #11 | Exceptional 49.7% |
| Swiss | 99.9 /100 | #12 | Exceptional 49.7% |
| Dutch | 99.9 /100 | #13 | Exceptional 49.6% |
| Germans | 99.9 /100 | #14 | Exceptional 49.6% |
| Pennsylvania Germans | 99.9 /100 | #15 | Exceptional 49.6% |
| Chinese | 99.9 /100 | #16 | Exceptional 49.5% |
| Scandinavians | 99.9 /100 | #17 | Exceptional 49.5% |
| Immigrants | Scotland | 99.8 /100 | #18 | Exceptional 49.3% |
| Europeans | 99.8 /100 | #19 | Exceptional 49.3% |
| Luxembourgers | 99.8 /100 | #20 | Exceptional 49.3% |
| Scottish | 99.8 /100 | #21 | Exceptional 49.2% |