Immigrants from Belarus vs Black/African American Married-couple Households
COMPARE
Immigrants from Belarus
Black/African American
Married-couple Households
Married-couple Households Comparison
Immigrants from Belarus
Blacks/African Americans
47.2%
MARRIED-COUPLE HOUSEHOLDS
83.8/ 100
METRIC RATING
143rd/ 347
METRIC RANK
38.5%
MARRIED-COUPLE HOUSEHOLDS
0.0/ 100
METRIC RATING
336th/ 347
METRIC RANK
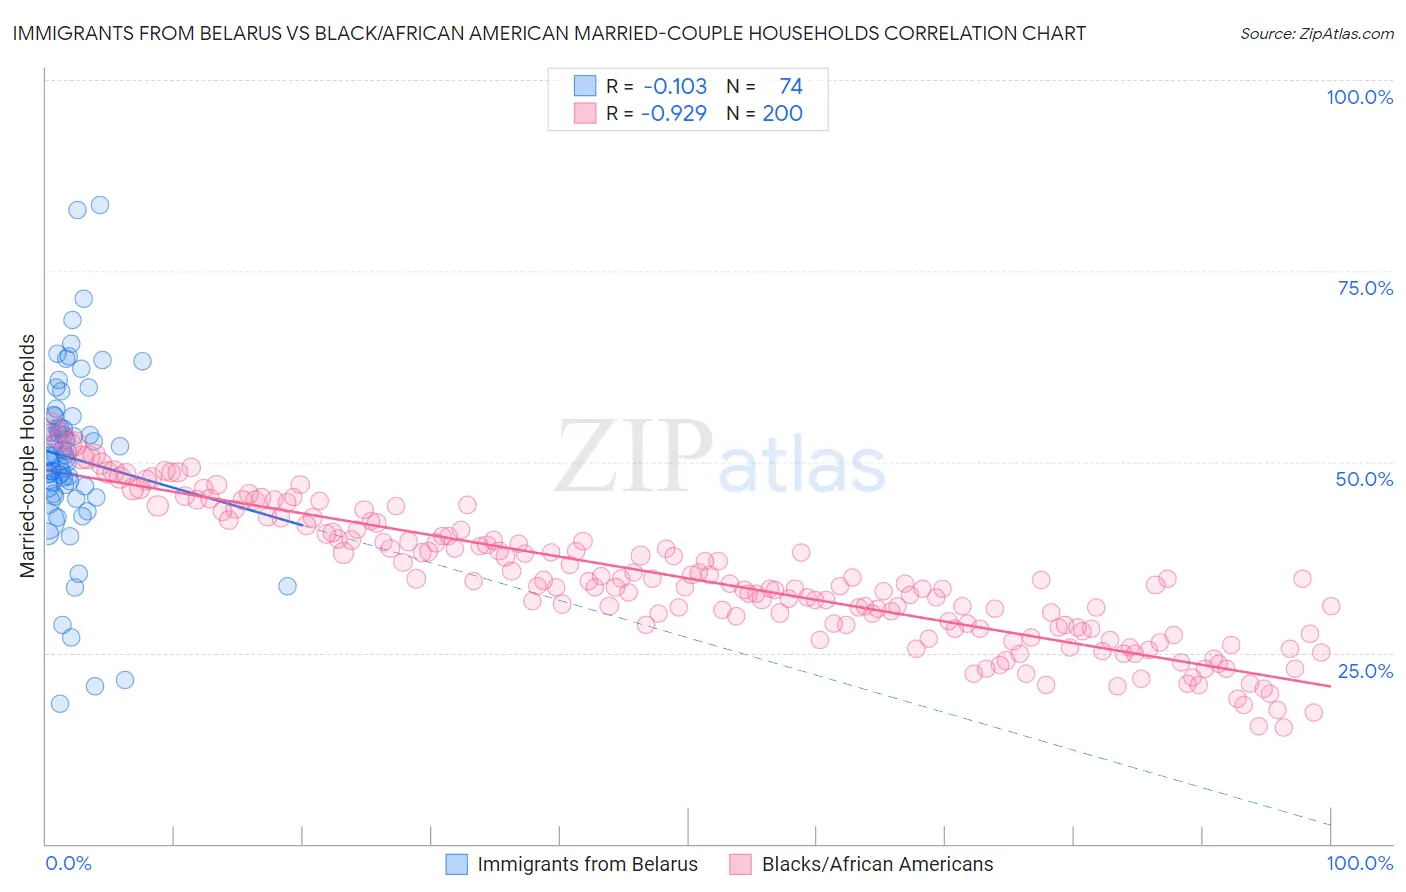
Immigrants from Belarus vs Black/African American Married-couple Households Correlation Chart
The statistical analysis conducted on geographies consisting of 150,189,140 people shows a poor negative correlation between the proportion of Immigrants from Belarus and percentage of married-couple family households in the United States with a correlation coefficient (R) of -0.103 and weighted average of 47.2%. Similarly, the statistical analysis conducted on geographies consisting of 565,301,242 people shows a near-perfect negative correlation between the proportion of Blacks/African Americans and percentage of married-couple family households in the United States with a correlation coefficient (R) of -0.929 and weighted average of 38.5%, a difference of 22.5%.
Married-couple Households Correlation Summary
| Measurement | Immigrants from Belarus | Black/African American |
| Minimum | 18.4% | 15.3% |
| Maximum | 83.7% | 54.8% |
| Range | 65.3% | 39.5% |
| Mean | 50.5% | 34.7% |
| Median | 50.8% | 34.0% |
| Interquartile 25% (IQ1) | 45.9% | 28.3% |
| Interquartile 75% (IQ3) | 55.9% | 41.0% |
| Interquartile Range (IQR) | 10.0% | 12.7% |
| Standard Deviation (Sample) | 11.7% | 8.8% |
| Standard Deviation (Population) | 11.6% | 8.8% |
Similar Demographics by Married-couple Households
Demographics Similar to Immigrants from Belarus by Married-couple Households
In terms of married-couple households, the demographic groups most similar to Immigrants from Belarus are Spaniard (47.2%, a difference of 0.020%), Mexican (47.1%, a difference of 0.020%), Costa Rican (47.2%, a difference of 0.040%), Spanish (47.2%, a difference of 0.050%), and Immigrants from Sweden (47.2%, a difference of 0.060%).
| Demographics | Rating | Rank | Married-couple Households |
| New Zealanders | 85.3 /100 | #136 | Excellent 47.2% |
| Immigrants | Malaysia | 85.2 /100 | #137 | Excellent 47.2% |
| Immigrants | Afghanistan | 85.1 /100 | #138 | Excellent 47.2% |
| Immigrants | Sweden | 84.7 /100 | #139 | Excellent 47.2% |
| Spanish | 84.5 /100 | #140 | Excellent 47.2% |
| Costa Ricans | 84.4 /100 | #141 | Excellent 47.2% |
| Spaniards | 84.1 /100 | #142 | Excellent 47.2% |
| Immigrants | Belarus | 83.8 /100 | #143 | Excellent 47.2% |
| Mexicans | 83.4 /100 | #144 | Excellent 47.1% |
| Slovenes | 81.7 /100 | #145 | Excellent 47.1% |
| Immigrants | Western Europe | 81.6 /100 | #146 | Excellent 47.1% |
| Immigrants | Syria | 81.6 /100 | #147 | Excellent 47.1% |
| Icelanders | 79.5 /100 | #148 | Good 47.0% |
| Paraguayans | 78.7 /100 | #149 | Good 47.0% |
| Immigrants | Russia | 77.6 /100 | #150 | Good 47.0% |
Demographics Similar to Blacks/African Americans by Married-couple Households
In terms of married-couple households, the demographic groups most similar to Blacks/African Americans are Immigrants from Somalia (38.4%, a difference of 0.14%), Senegalese (38.6%, a difference of 0.18%), Immigrants from Senegal (38.4%, a difference of 0.30%), British West Indian (38.3%, a difference of 0.43%), and Immigrants from St. Vincent and the Grenadines (38.7%, a difference of 0.51%).
| Demographics | Rating | Rank | Married-couple Households |
| Immigrants | Dominica | 0.0 /100 | #329 | Tragic 39.4% |
| Immigrants | Barbados | 0.0 /100 | #330 | Tragic 39.2% |
| Immigrants | Congo | 0.0 /100 | #331 | Tragic 39.0% |
| Somalis | 0.0 /100 | #332 | Tragic 39.0% |
| Immigrants | West Indies | 0.0 /100 | #333 | Tragic 39.0% |
| Immigrants | St. Vincent and the Grenadines | 0.0 /100 | #334 | Tragic 38.7% |
| Senegalese | 0.0 /100 | #335 | Tragic 38.6% |
| Blacks/African Americans | 0.0 /100 | #336 | Tragic 38.5% |
| Immigrants | Somalia | 0.0 /100 | #337 | Tragic 38.4% |
| Immigrants | Senegal | 0.0 /100 | #338 | Tragic 38.4% |
| British West Indians | 0.0 /100 | #339 | Tragic 38.3% |
| Dominicans | 0.0 /100 | #340 | Tragic 38.2% |
| Cape Verdeans | 0.0 /100 | #341 | Tragic 38.1% |
| Tohono O'odham | 0.0 /100 | #342 | Tragic 37.9% |
| Immigrants | Grenada | 0.0 /100 | #343 | Tragic 37.5% |