Liberian vs Black/African American Married-couple Households
COMPARE
Liberian
Black/African American
Married-couple Households
Married-couple Households Comparison
Liberians
Blacks/African Americans
40.7%
MARRIED-COUPLE HOUSEHOLDS
0.0/ 100
METRIC RATING
318th/ 347
METRIC RANK
38.5%
MARRIED-COUPLE HOUSEHOLDS
0.0/ 100
METRIC RATING
336th/ 347
METRIC RANK
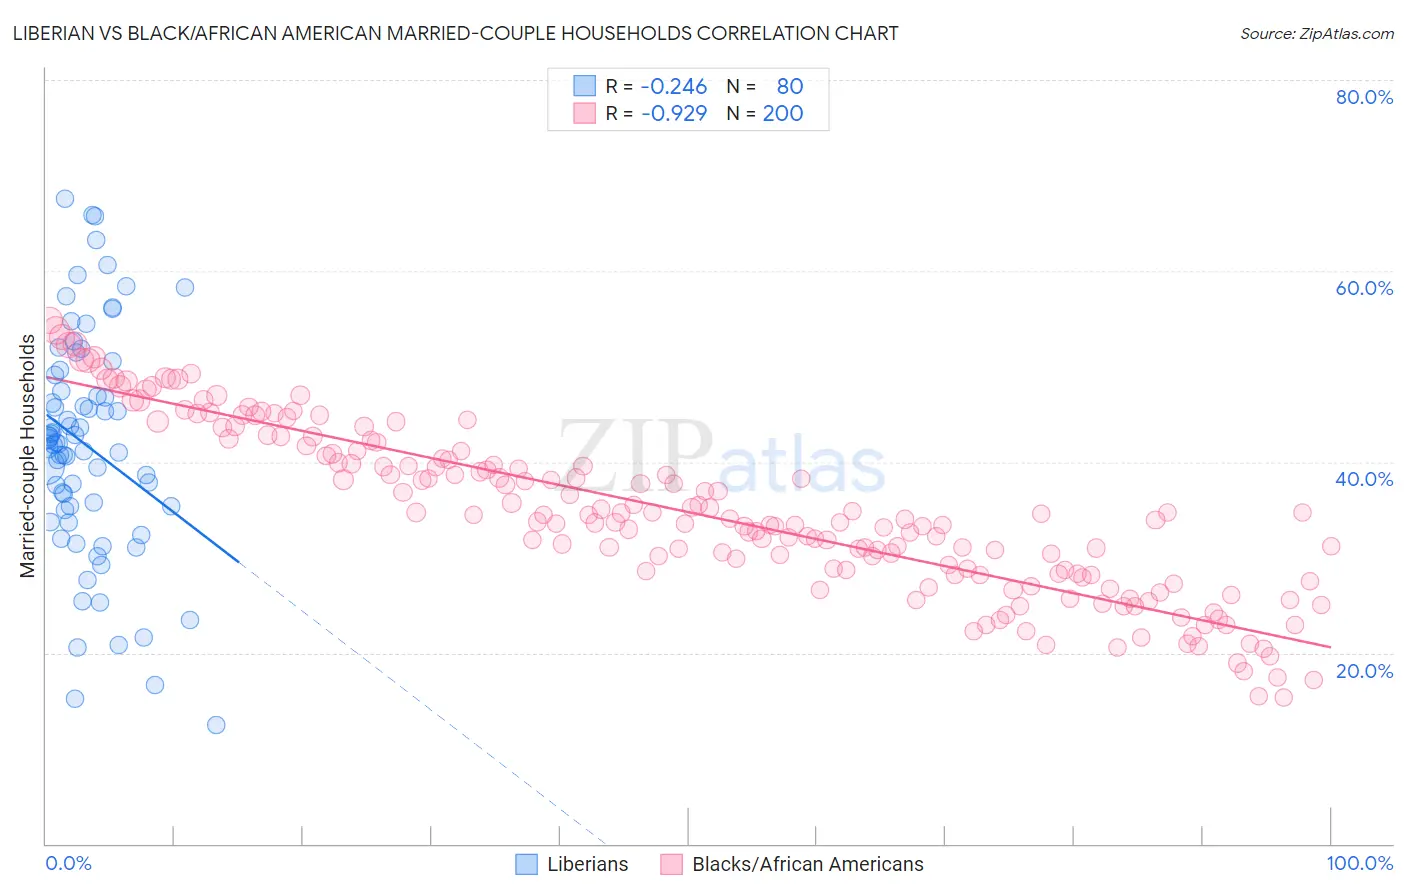
Liberian vs Black/African American Married-couple Households Correlation Chart
The statistical analysis conducted on geographies consisting of 118,032,066 people shows a weak negative correlation between the proportion of Liberians and percentage of married-couple family households in the United States with a correlation coefficient (R) of -0.246 and weighted average of 40.7%. Similarly, the statistical analysis conducted on geographies consisting of 565,301,242 people shows a near-perfect negative correlation between the proportion of Blacks/African Americans and percentage of married-couple family households in the United States with a correlation coefficient (R) of -0.929 and weighted average of 38.5%, a difference of 5.6%.
Married-couple Households Correlation Summary
| Measurement | Liberian | Black/African American |
| Minimum | 12.5% | 15.3% |
| Maximum | 67.6% | 54.8% |
| Range | 55.1% | 39.5% |
| Mean | 41.7% | 34.7% |
| Median | 42.0% | 34.0% |
| Interquartile 25% (IQ1) | 35.1% | 28.3% |
| Interquartile 75% (IQ3) | 48.2% | 41.0% |
| Interquartile Range (IQR) | 13.1% | 12.7% |
| Standard Deviation (Sample) | 11.9% | 8.8% |
| Standard Deviation (Population) | 11.8% | 8.8% |
Demographics Similar to Liberians and Blacks/African Americans by Married-couple Households
In terms of married-couple households, the demographic groups most similar to Liberians are Immigrants from Jamaica (40.7%, a difference of 0.010%), Bahamian (40.5%, a difference of 0.35%), West Indian (40.3%, a difference of 0.77%), Immigrants from Liberia (40.3%, a difference of 0.81%), and Immigrants from Zaire (40.1%, a difference of 1.5%). Similarly, the demographic groups most similar to Blacks/African Americans are Immigrants from Somalia (38.4%, a difference of 0.14%), Senegalese (38.6%, a difference of 0.18%), Immigrants from St. Vincent and the Grenadines (38.7%, a difference of 0.51%), Immigrants from West Indies (39.0%, a difference of 1.3%), and Somali (39.0%, a difference of 1.3%).
| Demographics | Rating | Rank | Married-couple Households |
| Immigrants | Jamaica | 0.0 /100 | #317 | Tragic 40.7% |
| Liberians | 0.0 /100 | #318 | Tragic 40.7% |
| Bahamians | 0.0 /100 | #319 | Tragic 40.5% |
| West Indians | 0.0 /100 | #320 | Tragic 40.3% |
| Immigrants | Liberia | 0.0 /100 | #321 | Tragic 40.3% |
| Immigrants | Zaire | 0.0 /100 | #322 | Tragic 40.1% |
| Puerto Ricans | 0.0 /100 | #323 | Tragic 40.1% |
| Navajo | 0.0 /100 | #324 | Tragic 40.1% |
| Pueblo | 0.0 /100 | #325 | Tragic 40.0% |
| U.S. Virgin Islanders | 0.0 /100 | #326 | Tragic 39.8% |
| Lumbee | 0.0 /100 | #327 | Tragic 39.6% |
| Barbadians | 0.0 /100 | #328 | Tragic 39.4% |
| Immigrants | Dominica | 0.0 /100 | #329 | Tragic 39.4% |
| Immigrants | Barbados | 0.0 /100 | #330 | Tragic 39.2% |
| Immigrants | Congo | 0.0 /100 | #331 | Tragic 39.0% |
| Somalis | 0.0 /100 | #332 | Tragic 39.0% |
| Immigrants | West Indies | 0.0 /100 | #333 | Tragic 39.0% |
| Immigrants | St. Vincent and the Grenadines | 0.0 /100 | #334 | Tragic 38.7% |
| Senegalese | 0.0 /100 | #335 | Tragic 38.6% |
| Blacks/African Americans | 0.0 /100 | #336 | Tragic 38.5% |
| Immigrants | Somalia | 0.0 /100 | #337 | Tragic 38.4% |