Immigrants from Jordan vs Arab Family Households
COMPARE
Immigrants from Jordan
Arab
Family Households
Family Households Comparison
Immigrants from Jordan
Arabs
65.0%
FAMILY HOUSEHOLDS
96.5/ 100
METRIC RATING
112th/ 347
METRIC RANK
64.1%
FAMILY HOUSEHOLDS
24.5/ 100
METRIC RATING
191st/ 347
METRIC RANK
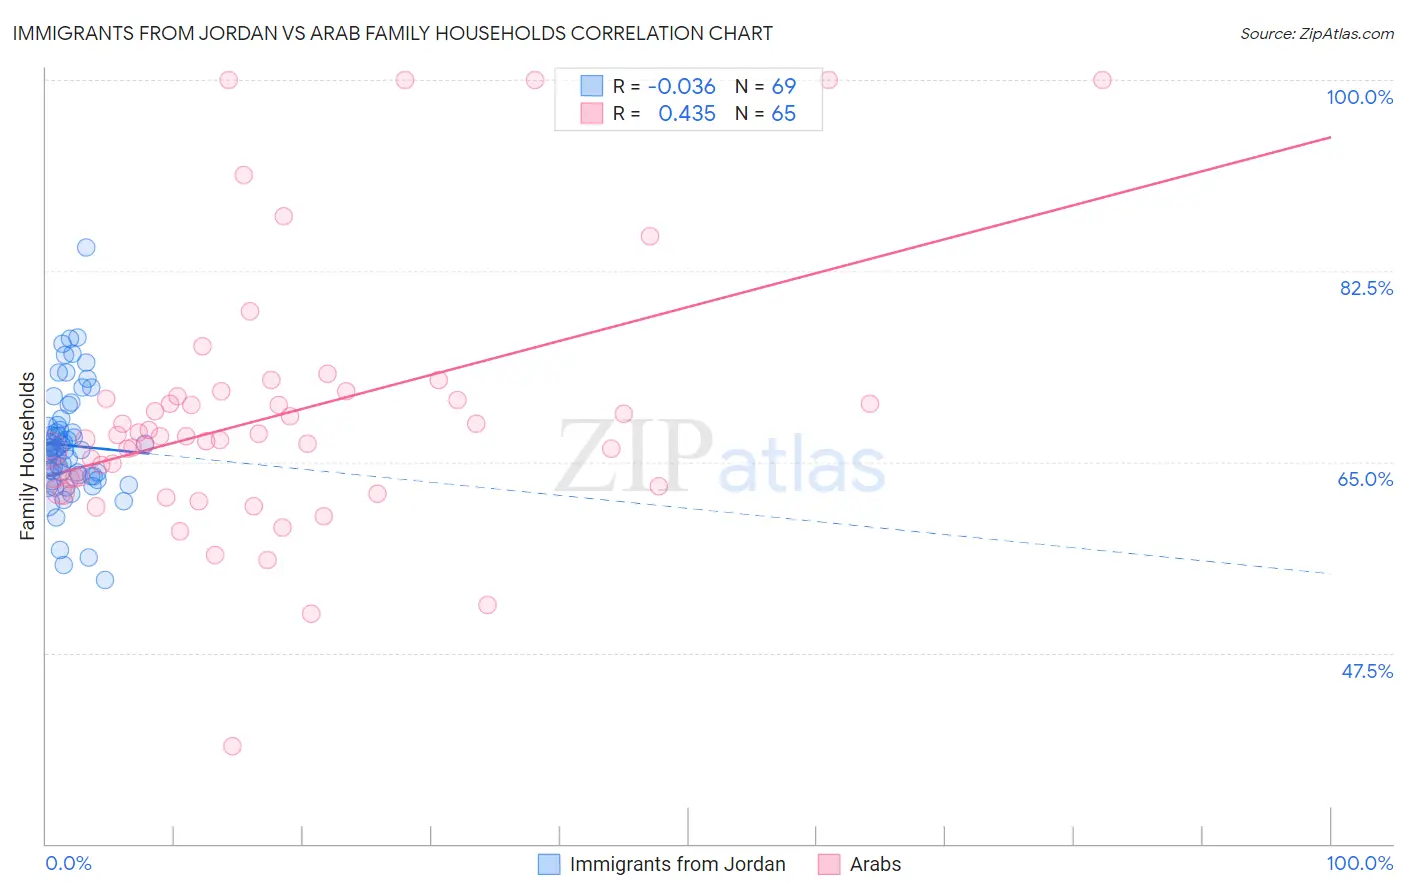
Immigrants from Jordan vs Arab Family Households Correlation Chart
The statistical analysis conducted on geographies consisting of 181,252,628 people shows no correlation between the proportion of Immigrants from Jordan and percentage of family households in the United States with a correlation coefficient (R) of -0.036 and weighted average of 65.0%. Similarly, the statistical analysis conducted on geographies consisting of 486,389,490 people shows a moderate positive correlation between the proportion of Arabs and percentage of family households in the United States with a correlation coefficient (R) of 0.435 and weighted average of 64.1%, a difference of 1.5%.
Family Households Correlation Summary
| Measurement | Immigrants from Jordan | Arab |
| Minimum | 54.2% | 38.9% |
| Maximum | 84.6% | 100.0% |
| Range | 30.4% | 61.1% |
| Mean | 66.5% | 69.2% |
| Median | 66.1% | 67.3% |
| Interquartile 25% (IQ1) | 63.7% | 63.1% |
| Interquartile 75% (IQ3) | 68.3% | 70.9% |
| Interquartile Range (IQR) | 4.6% | 7.8% |
| Standard Deviation (Sample) | 5.2% | 11.8% |
| Standard Deviation (Population) | 5.1% | 11.7% |
Similar Demographics by Family Households
Demographics Similar to Immigrants from Jordan by Family Households
In terms of family households, the demographic groups most similar to Immigrants from Jordan are European (65.0%, a difference of 0.030%), Spanish (65.0%, a difference of 0.030%), Scandinavian (65.0%, a difference of 0.040%), Immigrants from Guatemala (65.0%, a difference of 0.050%), and Argentinean (65.0%, a difference of 0.060%).
| Demographics | Rating | Rank | Family Households |
| English | 97.4 /100 | #105 | Exceptional 65.1% |
| Whites/Caucasians | 97.3 /100 | #106 | Exceptional 65.1% |
| Alaska Natives | 97.3 /100 | #107 | Exceptional 65.1% |
| Palestinians | 97.2 /100 | #108 | Exceptional 65.1% |
| Immigrants | Guatemala | 96.9 /100 | #109 | Exceptional 65.0% |
| Scandinavians | 96.8 /100 | #110 | Exceptional 65.0% |
| Europeans | 96.8 /100 | #111 | Exceptional 65.0% |
| Immigrants | Jordan | 96.5 /100 | #112 | Exceptional 65.0% |
| Spanish | 96.2 /100 | #113 | Exceptional 65.0% |
| Argentineans | 95.7 /100 | #114 | Exceptional 65.0% |
| Ecuadorians | 95.4 /100 | #115 | Exceptional 65.0% |
| Immigrants | Iraq | 95.4 /100 | #116 | Exceptional 65.0% |
| Cherokee | 95.3 /100 | #117 | Exceptional 65.0% |
| Dutch | 95.1 /100 | #118 | Exceptional 64.9% |
| Immigrants | Eastern Asia | 94.4 /100 | #119 | Exceptional 64.9% |
Demographics Similar to Arabs by Family Households
In terms of family households, the demographic groups most similar to Arabs are Zimbabwean (64.1%, a difference of 0.0%), Lithuanian (64.0%, a difference of 0.010%), French (64.0%, a difference of 0.010%), Immigrants from Western Asia (64.1%, a difference of 0.020%), and Paraguayan (64.1%, a difference of 0.040%).
| Demographics | Rating | Rank | Family Households |
| Puerto Ricans | 33.4 /100 | #184 | Fair 64.2% |
| Immigrants | Iran | 30.4 /100 | #185 | Fair 64.1% |
| Spanish Americans | 30.1 /100 | #186 | Fair 64.1% |
| Northern Europeans | 28.2 /100 | #187 | Fair 64.1% |
| Paraguayans | 26.7 /100 | #188 | Fair 64.1% |
| Immigrants | Western Asia | 25.3 /100 | #189 | Fair 64.1% |
| Zimbabweans | 24.7 /100 | #190 | Fair 64.1% |
| Arabs | 24.5 /100 | #191 | Fair 64.1% |
| Lithuanians | 23.8 /100 | #192 | Fair 64.0% |
| French | 23.7 /100 | #193 | Fair 64.0% |
| Paiute | 22.2 /100 | #194 | Fair 64.0% |
| Immigrants | North America | 20.0 /100 | #195 | Poor 64.0% |
| Immigrants | Canada | 19.2 /100 | #196 | Poor 64.0% |
| Seminole | 18.9 /100 | #197 | Poor 64.0% |
| Poles | 18.9 /100 | #198 | Poor 64.0% |