Immigrants from Jordan vs Senegalese Family Households
COMPARE
Immigrants from Jordan
Senegalese
Family Households
Family Households Comparison
Immigrants from Jordan
Senegalese
65.0%
FAMILY HOUSEHOLDS
96.5/ 100
METRIC RATING
112th/ 347
METRIC RANK
59.8%
FAMILY HOUSEHOLDS
0.0/ 100
METRIC RATING
343rd/ 347
METRIC RANK
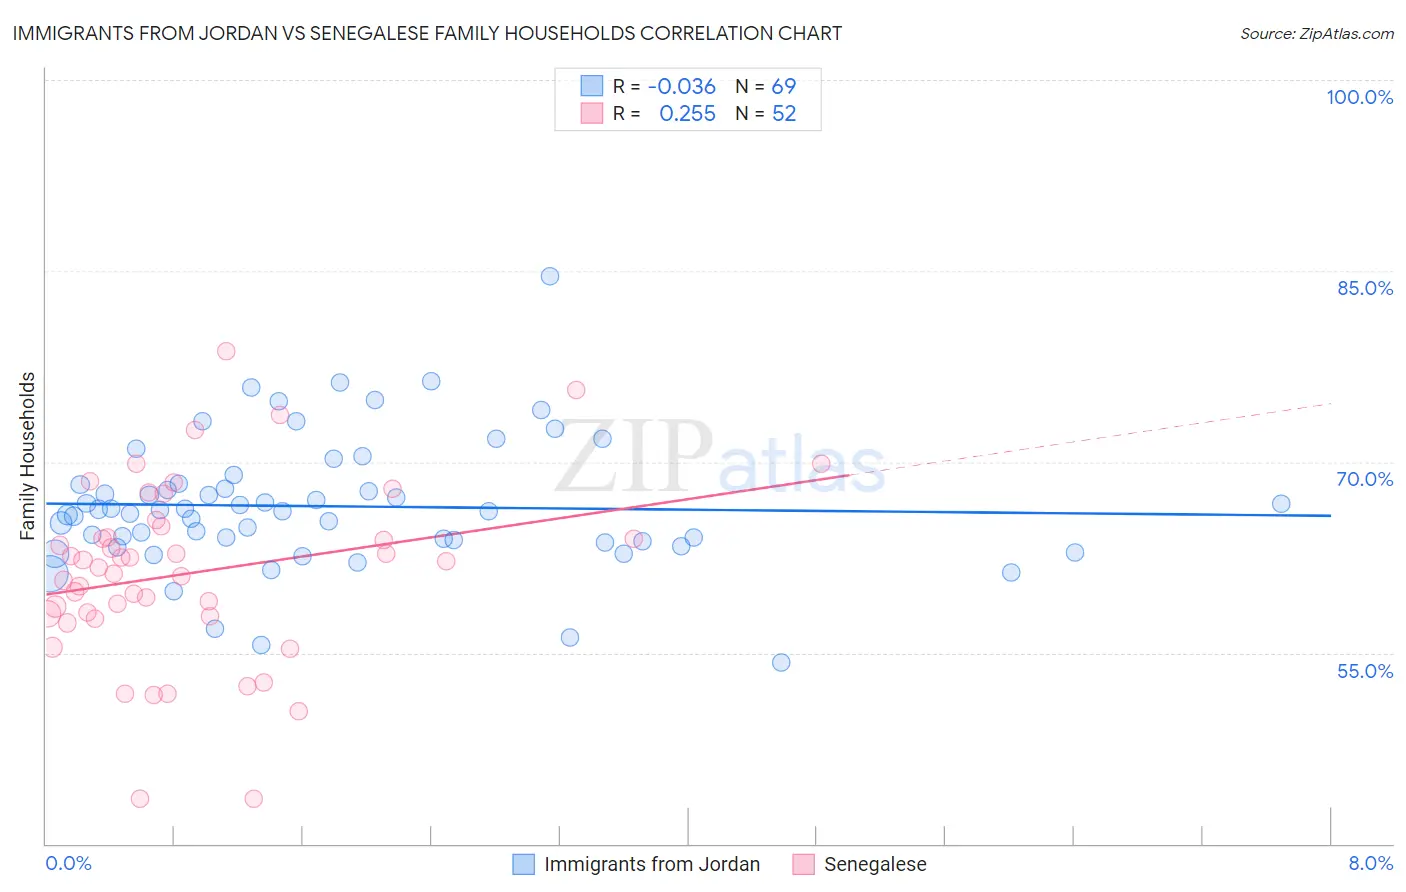
Immigrants from Jordan vs Senegalese Family Households Correlation Chart
The statistical analysis conducted on geographies consisting of 181,252,628 people shows no correlation between the proportion of Immigrants from Jordan and percentage of family households in the United States with a correlation coefficient (R) of -0.036 and weighted average of 65.0%. Similarly, the statistical analysis conducted on geographies consisting of 78,113,781 people shows a weak positive correlation between the proportion of Senegalese and percentage of family households in the United States with a correlation coefficient (R) of 0.255 and weighted average of 59.8%, a difference of 8.7%.
Family Households Correlation Summary
| Measurement | Immigrants from Jordan | Senegalese |
| Minimum | 54.2% | 43.5% |
| Maximum | 84.6% | 78.7% |
| Range | 30.4% | 35.1% |
| Mean | 66.5% | 61.3% |
| Median | 66.1% | 61.9% |
| Interquartile 25% (IQ1) | 63.7% | 58.0% |
| Interquartile 75% (IQ3) | 68.3% | 64.5% |
| Interquartile Range (IQR) | 4.6% | 6.5% |
| Standard Deviation (Sample) | 5.2% | 7.1% |
| Standard Deviation (Population) | 5.1% | 7.0% |
Similar Demographics by Family Households
Demographics Similar to Immigrants from Jordan by Family Households
In terms of family households, the demographic groups most similar to Immigrants from Jordan are European (65.0%, a difference of 0.030%), Spanish (65.0%, a difference of 0.030%), Scandinavian (65.0%, a difference of 0.040%), Immigrants from Guatemala (65.0%, a difference of 0.050%), and Argentinean (65.0%, a difference of 0.060%).
| Demographics | Rating | Rank | Family Households |
| English | 97.4 /100 | #105 | Exceptional 65.1% |
| Whites/Caucasians | 97.3 /100 | #106 | Exceptional 65.1% |
| Alaska Natives | 97.3 /100 | #107 | Exceptional 65.1% |
| Palestinians | 97.2 /100 | #108 | Exceptional 65.1% |
| Immigrants | Guatemala | 96.9 /100 | #109 | Exceptional 65.0% |
| Scandinavians | 96.8 /100 | #110 | Exceptional 65.0% |
| Europeans | 96.8 /100 | #111 | Exceptional 65.0% |
| Immigrants | Jordan | 96.5 /100 | #112 | Exceptional 65.0% |
| Spanish | 96.2 /100 | #113 | Exceptional 65.0% |
| Argentineans | 95.7 /100 | #114 | Exceptional 65.0% |
| Ecuadorians | 95.4 /100 | #115 | Exceptional 65.0% |
| Immigrants | Iraq | 95.4 /100 | #116 | Exceptional 65.0% |
| Cherokee | 95.3 /100 | #117 | Exceptional 65.0% |
| Dutch | 95.1 /100 | #118 | Exceptional 64.9% |
| Immigrants | Eastern Asia | 94.4 /100 | #119 | Exceptional 64.9% |
Demographics Similar to Senegalese by Family Households
In terms of family households, the demographic groups most similar to Senegalese are Sudanese (60.0%, a difference of 0.30%), Immigrants from Senegal (60.1%, a difference of 0.48%), Immigrants from Sudan (60.2%, a difference of 0.57%), Immigrants from Congo (59.2%, a difference of 0.97%), and Immigrants from Zaire (59.2%, a difference of 1.1%).
| Demographics | Rating | Rank | Family Households |
| Immigrants | Ethiopia | 0.0 /100 | #333 | Tragic 61.2% |
| Immigrants | Eastern Africa | 0.0 /100 | #334 | Tragic 61.1% |
| Carpatho Rusyns | 0.0 /100 | #335 | Tragic 61.1% |
| German Russians | 0.0 /100 | #336 | Tragic 60.9% |
| Soviet Union | 0.0 /100 | #337 | Tragic 60.9% |
| Immigrants | Eritrea | 0.0 /100 | #338 | Tragic 60.8% |
| Immigrants | Saudi Arabia | 0.0 /100 | #339 | Tragic 60.7% |
| Immigrants | Sudan | 0.0 /100 | #340 | Tragic 60.2% |
| Immigrants | Senegal | 0.0 /100 | #341 | Tragic 60.1% |
| Sudanese | 0.0 /100 | #342 | Tragic 60.0% |
| Senegalese | 0.0 /100 | #343 | Tragic 59.8% |
| Immigrants | Congo | 0.0 /100 | #344 | Tragic 59.2% |
| Immigrants | Zaire | 0.0 /100 | #345 | Tragic 59.2% |
| Somalis | 0.0 /100 | #346 | Tragic 57.6% |
| Immigrants | Somalia | 0.0 /100 | #347 | Tragic 56.7% |