Immigrants from Italy vs Immigrants from Grenada Bachelor's Degree
COMPARE
Immigrants from Italy
Immigrants from Grenada
Bachelor's Degree
Bachelor's Degree Comparison
Immigrants from Italy
Immigrants from Grenada
41.3%
BACHELOR'S DEGREE
97.8/ 100
METRIC RATING
102nd/ 347
METRIC RANK
35.0%
BACHELOR'S DEGREE
4.3/ 100
METRIC RATING
230th/ 347
METRIC RANK
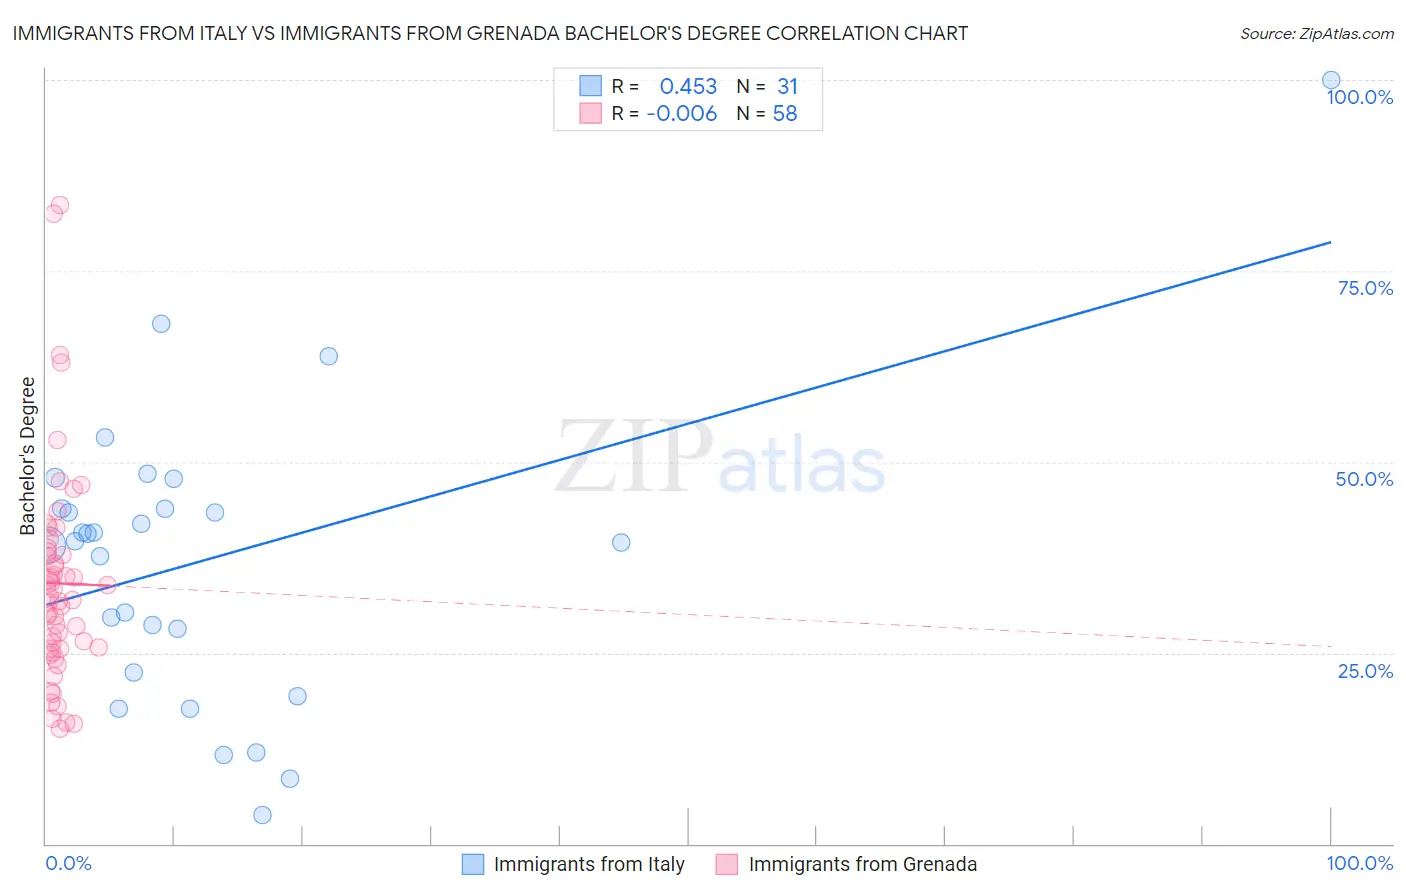
Immigrants from Italy vs Immigrants from Grenada Bachelor's Degree Correlation Chart
The statistical analysis conducted on geographies consisting of 324,223,124 people shows a moderate positive correlation between the proportion of Immigrants from Italy and percentage of population with at least bachelor's degree education in the United States with a correlation coefficient (R) of 0.453 and weighted average of 41.3%. Similarly, the statistical analysis conducted on geographies consisting of 67,201,096 people shows no correlation between the proportion of Immigrants from Grenada and percentage of population with at least bachelor's degree education in the United States with a correlation coefficient (R) of -0.006 and weighted average of 35.0%, a difference of 18.1%.
Bachelor's Degree Correlation Summary
| Measurement | Immigrants from Italy | Immigrants from Grenada |
| Minimum | 3.7% | 15.1% |
| Maximum | 100.0% | 83.6% |
| Range | 96.3% | 68.5% |
| Mean | 37.2% | 34.1% |
| Median | 39.6% | 32.1% |
| Interquartile 25% (IQ1) | 22.5% | 25.5% |
| Interquartile 75% (IQ3) | 43.9% | 38.2% |
| Interquartile Range (IQR) | 21.5% | 12.7% |
| Standard Deviation (Sample) | 19.4% | 14.0% |
| Standard Deviation (Population) | 19.1% | 13.8% |
Similar Demographics by Bachelor's Degree
Demographics Similar to Immigrants from Italy by Bachelor's Degree
In terms of bachelor's degree, the demographic groups most similar to Immigrants from Italy are Immigrants from Morocco (41.4%, a difference of 0.26%), Macedonian (41.4%, a difference of 0.29%), Immigrants from England (41.4%, a difference of 0.32%), Chilean (41.2%, a difference of 0.34%), and Jordanian (41.2%, a difference of 0.40%).
| Demographics | Rating | Rank | Bachelor's Degree |
| Immigrants | North America | 98.5 /100 | #95 | Exceptional 41.7% |
| Immigrants | Moldova | 98.4 /100 | #96 | Exceptional 41.6% |
| Romanians | 98.4 /100 | #97 | Exceptional 41.6% |
| Immigrants | Ukraine | 98.3 /100 | #98 | Exceptional 41.5% |
| Immigrants | England | 98.1 /100 | #99 | Exceptional 41.4% |
| Macedonians | 98.1 /100 | #100 | Exceptional 41.4% |
| Immigrants | Morocco | 98.0 /100 | #101 | Exceptional 41.4% |
| Immigrants | Italy | 97.8 /100 | #102 | Exceptional 41.3% |
| Chileans | 97.5 /100 | #103 | Exceptional 41.2% |
| Jordanians | 97.4 /100 | #104 | Exceptional 41.2% |
| Syrians | 97.4 /100 | #105 | Exceptional 41.1% |
| Alsatians | 97.0 /100 | #106 | Exceptional 41.0% |
| Northern Europeans | 96.8 /100 | #107 | Exceptional 41.0% |
| Ukrainians | 96.6 /100 | #108 | Exceptional 40.9% |
| Arabs | 96.6 /100 | #109 | Exceptional 40.9% |
Demographics Similar to Immigrants from Grenada by Bachelor's Degree
In terms of bachelor's degree, the demographic groups most similar to Immigrants from Grenada are Immigrants from St. Vincent and the Grenadines (35.0%, a difference of 0.020%), Hmong (34.8%, a difference of 0.65%), Immigrants from Ecuador (34.7%, a difference of 0.76%), White/Caucasian (35.3%, a difference of 0.84%), and Immigrants from Trinidad and Tobago (35.3%, a difference of 0.93%).
| Demographics | Rating | Rank | Bachelor's Degree |
| French Canadians | 8.3 /100 | #223 | Tragic 35.6% |
| Immigrants | Barbados | 7.5 /100 | #224 | Tragic 35.5% |
| Immigrants | Burma/Myanmar | 7.3 /100 | #225 | Tragic 35.5% |
| Portuguese | 7.2 /100 | #226 | Tragic 35.5% |
| Ecuadorians | 6.6 /100 | #227 | Tragic 35.4% |
| Immigrants | Trinidad and Tobago | 6.0 /100 | #228 | Tragic 35.3% |
| Whites/Caucasians | 5.9 /100 | #229 | Tragic 35.3% |
| Immigrants | Grenada | 4.3 /100 | #230 | Tragic 35.0% |
| Immigrants | St. Vincent and the Grenadines | 4.3 /100 | #231 | Tragic 35.0% |
| Hmong | 3.4 /100 | #232 | Tragic 34.8% |
| Immigrants | Ecuador | 3.3 /100 | #233 | Tragic 34.7% |
| Guamanians/Chamorros | 3.0 /100 | #234 | Tragic 34.6% |
| Immigrants | West Indies | 2.9 /100 | #235 | Tragic 34.6% |
| Liberians | 2.8 /100 | #236 | Tragic 34.6% |
| Tlingit-Haida | 2.8 /100 | #237 | Tragic 34.6% |