Immigrants from Indonesia vs Chinese Family Households
COMPARE
Immigrants from Indonesia
Chinese
Family Households
Family Households Comparison
Immigrants from Indonesia
Chinese
66.0%
FAMILY HOUSEHOLDS
100.0/ 100
METRIC RATING
63rd/ 347
METRIC RANK
68.1%
FAMILY HOUSEHOLDS
100.0/ 100
METRIC RATING
17th/ 347
METRIC RANK
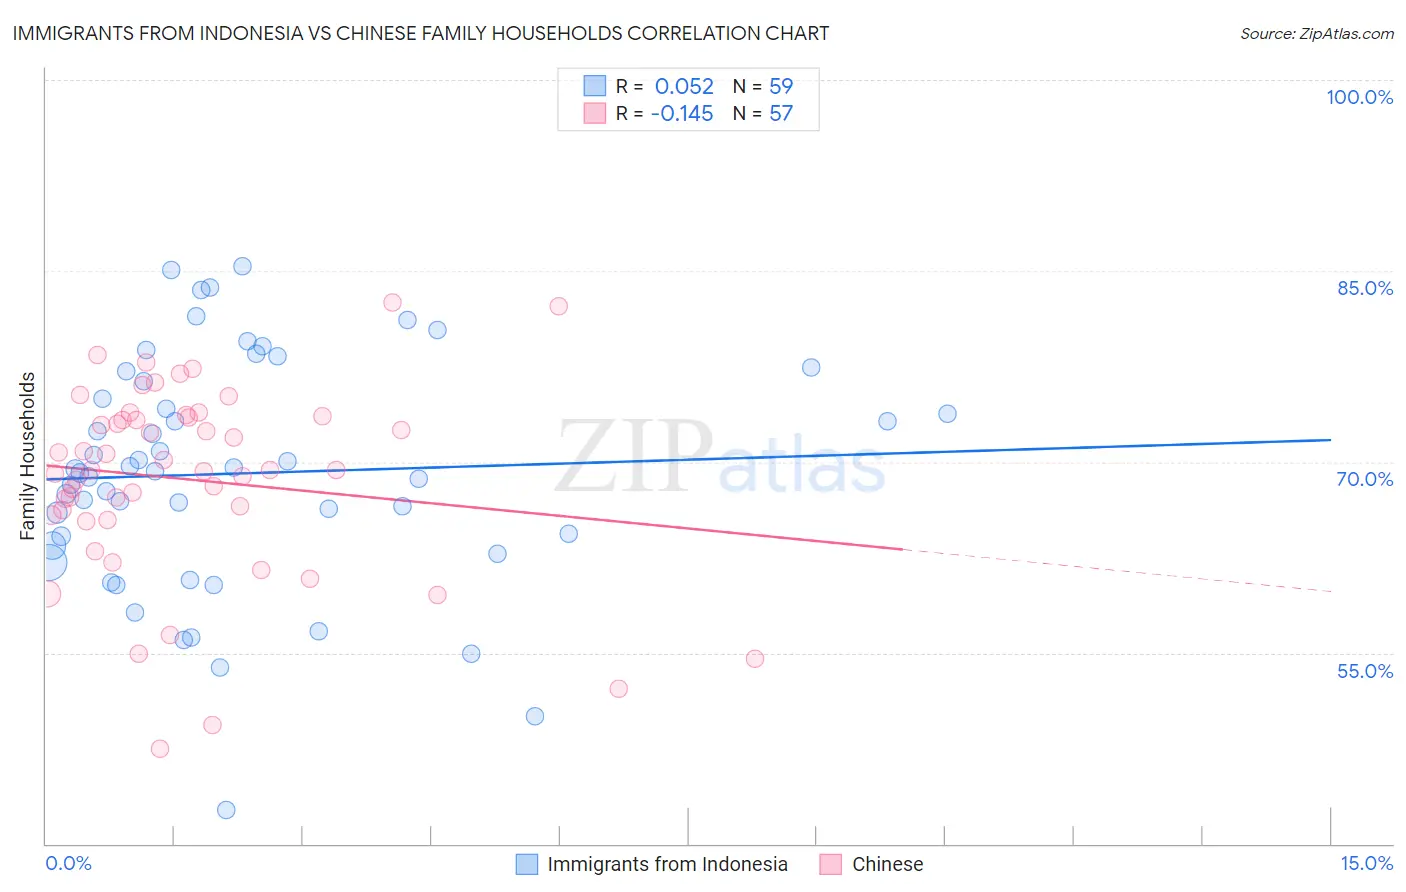
Immigrants from Indonesia vs Chinese Family Households Correlation Chart
The statistical analysis conducted on geographies consisting of 215,720,751 people shows a slight positive correlation between the proportion of Immigrants from Indonesia and percentage of family households in the United States with a correlation coefficient (R) of 0.052 and weighted average of 66.0%. Similarly, the statistical analysis conducted on geographies consisting of 64,801,742 people shows a poor negative correlation between the proportion of Chinese and percentage of family households in the United States with a correlation coefficient (R) of -0.145 and weighted average of 68.1%, a difference of 3.3%.
Family Households Correlation Summary
| Measurement | Immigrants from Indonesia | Chinese |
| Minimum | 42.7% | 47.5% |
| Maximum | 85.4% | 82.6% |
| Range | 42.7% | 35.1% |
| Mean | 69.1% | 68.6% |
| Median | 69.3% | 69.4% |
| Interquartile 25% (IQ1) | 63.4% | 65.6% |
| Interquartile 75% (IQ3) | 76.3% | 73.5% |
| Interquartile Range (IQR) | 12.9% | 7.9% |
| Standard Deviation (Sample) | 9.1% | 7.6% |
| Standard Deviation (Population) | 9.0% | 7.5% |
Similar Demographics by Family Households
Demographics Similar to Immigrants from Indonesia by Family Households
In terms of family households, the demographic groups most similar to Immigrants from Indonesia are Central American (66.0%, a difference of 0.040%), Pima (65.9%, a difference of 0.060%), Danish (66.0%, a difference of 0.070%), Costa Rican (65.9%, a difference of 0.070%), and South American (66.0%, a difference of 0.090%).
| Demographics | Rating | Rank | Family Households |
| Immigrants | Hong Kong | 100.0 /100 | #56 | Exceptional 66.1% |
| Pennsylvania Germans | 100.0 /100 | #57 | Exceptional 66.1% |
| Immigrants | Asia | 100.0 /100 | #58 | Exceptional 66.1% |
| Immigrants | Korea | 100.0 /100 | #59 | Exceptional 66.0% |
| South Americans | 100.0 /100 | #60 | Exceptional 66.0% |
| Danes | 100.0 /100 | #61 | Exceptional 66.0% |
| Central Americans | 100.0 /100 | #62 | Exceptional 66.0% |
| Immigrants | Indonesia | 100.0 /100 | #63 | Exceptional 66.0% |
| Pima | 99.9 /100 | #64 | Exceptional 65.9% |
| Costa Ricans | 99.9 /100 | #65 | Exceptional 65.9% |
| Fijians | 99.9 /100 | #66 | Exceptional 65.9% |
| Filipinos | 99.9 /100 | #67 | Exceptional 65.9% |
| Japanese | 99.9 /100 | #68 | Exceptional 65.9% |
| Malaysians | 99.9 /100 | #69 | Exceptional 65.9% |
| Immigrants | Afghanistan | 99.9 /100 | #70 | Exceptional 65.9% |
Demographics Similar to Chinese by Family Households
In terms of family households, the demographic groups most similar to Chinese are Immigrants from Vietnam (68.2%, a difference of 0.030%), Assyrian/Chaldean/Syriac (68.2%, a difference of 0.040%), Pueblo (68.2%, a difference of 0.10%), Immigrants from Cuba (68.2%, a difference of 0.10%), and Immigrants from Taiwan (68.0%, a difference of 0.16%).
| Demographics | Rating | Rank | Family Households |
| Immigrants | Philippines | 100.0 /100 | #10 | Exceptional 68.3% |
| Immigrants | Central America | 100.0 /100 | #11 | Exceptional 68.3% |
| Koreans | 100.0 /100 | #12 | Exceptional 68.3% |
| Pueblo | 100.0 /100 | #13 | Exceptional 68.2% |
| Immigrants | Cuba | 100.0 /100 | #14 | Exceptional 68.2% |
| Assyrians/Chaldeans/Syriacs | 100.0 /100 | #15 | Exceptional 68.2% |
| Immigrants | Vietnam | 100.0 /100 | #16 | Exceptional 68.2% |
| Chinese | 100.0 /100 | #17 | Exceptional 68.1% |
| Immigrants | Taiwan | 100.0 /100 | #18 | Exceptional 68.0% |
| Samoans | 100.0 /100 | #19 | Exceptional 67.9% |
| Inupiat | 100.0 /100 | #20 | Exceptional 67.8% |
| Cubans | 100.0 /100 | #21 | Exceptional 67.7% |
| Sri Lankans | 100.0 /100 | #22 | Exceptional 67.7% |
| Immigrants | Pakistan | 100.0 /100 | #23 | Exceptional 67.7% |
| Immigrants | South Eastern Asia | 100.0 /100 | #24 | Exceptional 67.5% |