Immigrants from Indonesia vs Basque Family Households
COMPARE
Immigrants from Indonesia
Basque
Family Households
Family Households Comparison
Immigrants from Indonesia
Basques
66.0%
FAMILY HOUSEHOLDS
100.0/ 100
METRIC RATING
63rd/ 347
METRIC RANK
64.7%
FAMILY HOUSEHOLDS
85.5/ 100
METRIC RATING
138th/ 347
METRIC RANK
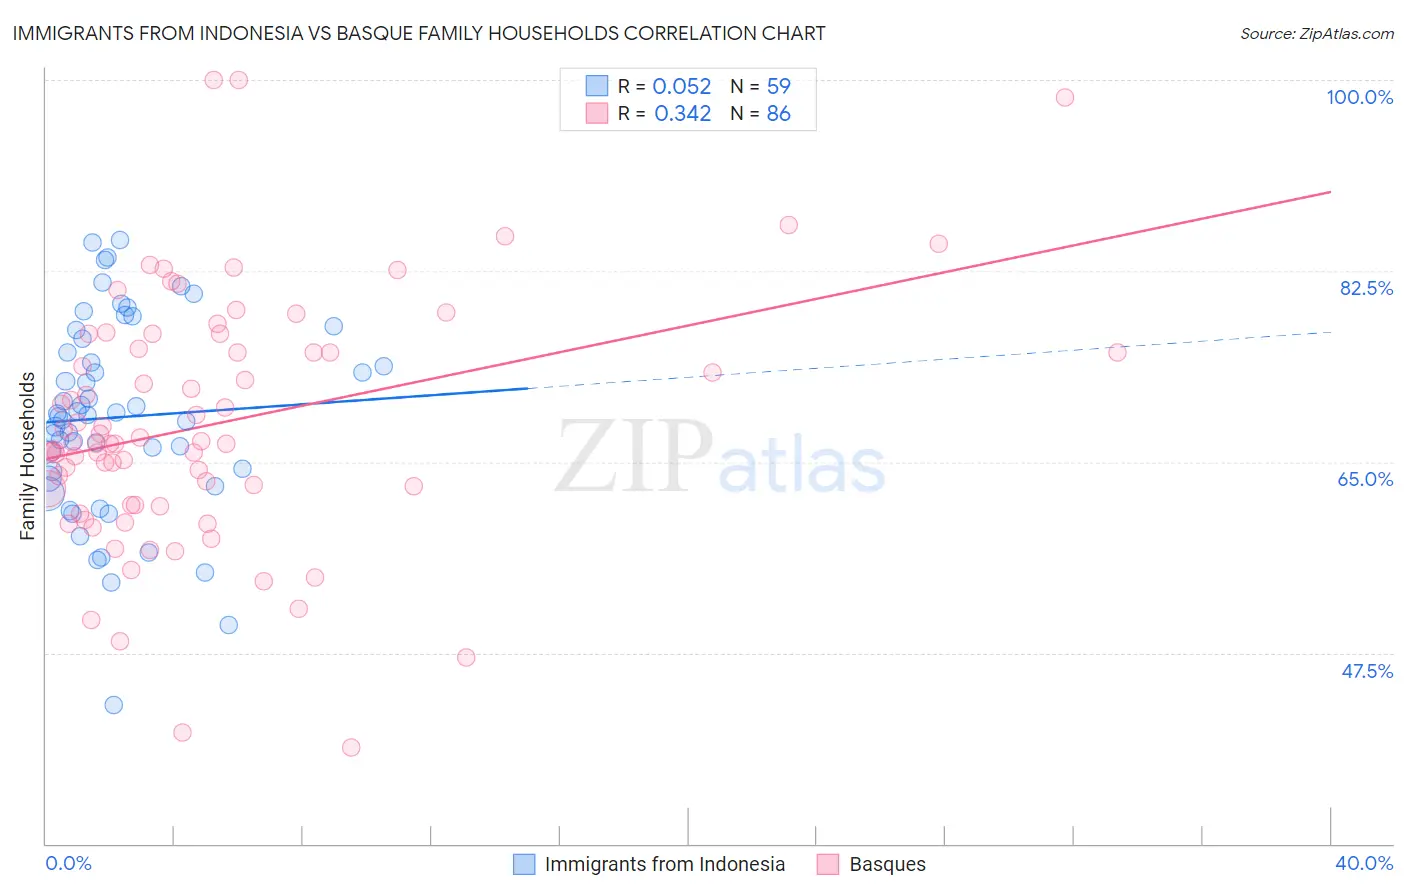
Immigrants from Indonesia vs Basque Family Households Correlation Chart
The statistical analysis conducted on geographies consisting of 215,720,751 people shows a slight positive correlation between the proportion of Immigrants from Indonesia and percentage of family households in the United States with a correlation coefficient (R) of 0.052 and weighted average of 66.0%. Similarly, the statistical analysis conducted on geographies consisting of 165,752,297 people shows a mild positive correlation between the proportion of Basques and percentage of family households in the United States with a correlation coefficient (R) of 0.342 and weighted average of 64.7%, a difference of 2.0%.
Family Households Correlation Summary
| Measurement | Immigrants from Indonesia | Basque |
| Minimum | 42.7% | 38.8% |
| Maximum | 85.4% | 100.0% |
| Range | 42.7% | 61.2% |
| Mean | 69.1% | 68.5% |
| Median | 69.3% | 66.7% |
| Interquartile 25% (IQ1) | 63.4% | 61.1% |
| Interquartile 75% (IQ3) | 76.3% | 75.3% |
| Interquartile Range (IQR) | 12.9% | 14.3% |
| Standard Deviation (Sample) | 9.1% | 11.5% |
| Standard Deviation (Population) | 9.0% | 11.4% |
Similar Demographics by Family Households
Demographics Similar to Immigrants from Indonesia by Family Households
In terms of family households, the demographic groups most similar to Immigrants from Indonesia are Central American (66.0%, a difference of 0.040%), Pima (65.9%, a difference of 0.060%), Danish (66.0%, a difference of 0.070%), Costa Rican (65.9%, a difference of 0.070%), and South American (66.0%, a difference of 0.090%).
| Demographics | Rating | Rank | Family Households |
| Immigrants | Hong Kong | 100.0 /100 | #56 | Exceptional 66.1% |
| Pennsylvania Germans | 100.0 /100 | #57 | Exceptional 66.1% |
| Immigrants | Asia | 100.0 /100 | #58 | Exceptional 66.1% |
| Immigrants | Korea | 100.0 /100 | #59 | Exceptional 66.0% |
| South Americans | 100.0 /100 | #60 | Exceptional 66.0% |
| Danes | 100.0 /100 | #61 | Exceptional 66.0% |
| Central Americans | 100.0 /100 | #62 | Exceptional 66.0% |
| Immigrants | Indonesia | 100.0 /100 | #63 | Exceptional 66.0% |
| Pima | 99.9 /100 | #64 | Exceptional 65.9% |
| Costa Ricans | 99.9 /100 | #65 | Exceptional 65.9% |
| Fijians | 99.9 /100 | #66 | Exceptional 65.9% |
| Filipinos | 99.9 /100 | #67 | Exceptional 65.9% |
| Japanese | 99.9 /100 | #68 | Exceptional 65.9% |
| Malaysians | 99.9 /100 | #69 | Exceptional 65.9% |
| Immigrants | Afghanistan | 99.9 /100 | #70 | Exceptional 65.9% |
Demographics Similar to Basques by Family Households
In terms of family households, the demographic groups most similar to Basques are Immigrants from Jamaica (64.7%, a difference of 0.010%), Immigrants from Scotland (64.7%, a difference of 0.020%), Immigrants from North Macedonia (64.7%, a difference of 0.020%), Immigrants from Cameroon (64.7%, a difference of 0.020%), and Immigrants from China (64.7%, a difference of 0.030%).
| Demographics | Rating | Rank | Family Households |
| Immigrants | Nonimmigrants | 90.1 /100 | #131 | Exceptional 64.8% |
| Cajuns | 89.4 /100 | #132 | Excellent 64.8% |
| Belizeans | 89.3 /100 | #133 | Excellent 64.8% |
| Greeks | 88.1 /100 | #134 | Excellent 64.7% |
| Maltese | 87.4 /100 | #135 | Excellent 64.7% |
| Immigrants | China | 86.6 /100 | #136 | Excellent 64.7% |
| Immigrants | Scotland | 86.4 /100 | #137 | Excellent 64.7% |
| Basques | 85.5 /100 | #138 | Excellent 64.7% |
| Immigrants | Jamaica | 85.3 /100 | #139 | Excellent 64.7% |
| Immigrants | North Macedonia | 84.9 /100 | #140 | Excellent 64.7% |
| Immigrants | Cameroon | 84.8 /100 | #141 | Excellent 64.7% |
| Pakistanis | 84.0 /100 | #142 | Excellent 64.7% |
| Czechoslovakians | 82.1 /100 | #143 | Excellent 64.6% |
| South American Indians | 81.9 /100 | #144 | Excellent 64.6% |
| Welsh | 80.1 /100 | #145 | Excellent 64.6% |