Immigrants from Indonesia vs Thai Currently Married
COMPARE
Immigrants from Indonesia
Thai
Currently Married
Currently Married Comparison
Immigrants from Indonesia
Thais
47.6%
CURRENTLY MARRIED
90.5/ 100
METRIC RATING
115th/ 347
METRIC RANK
50.9%
CURRENTLY MARRIED
100.0/ 100
METRIC RATING
2nd/ 347
METRIC RANK
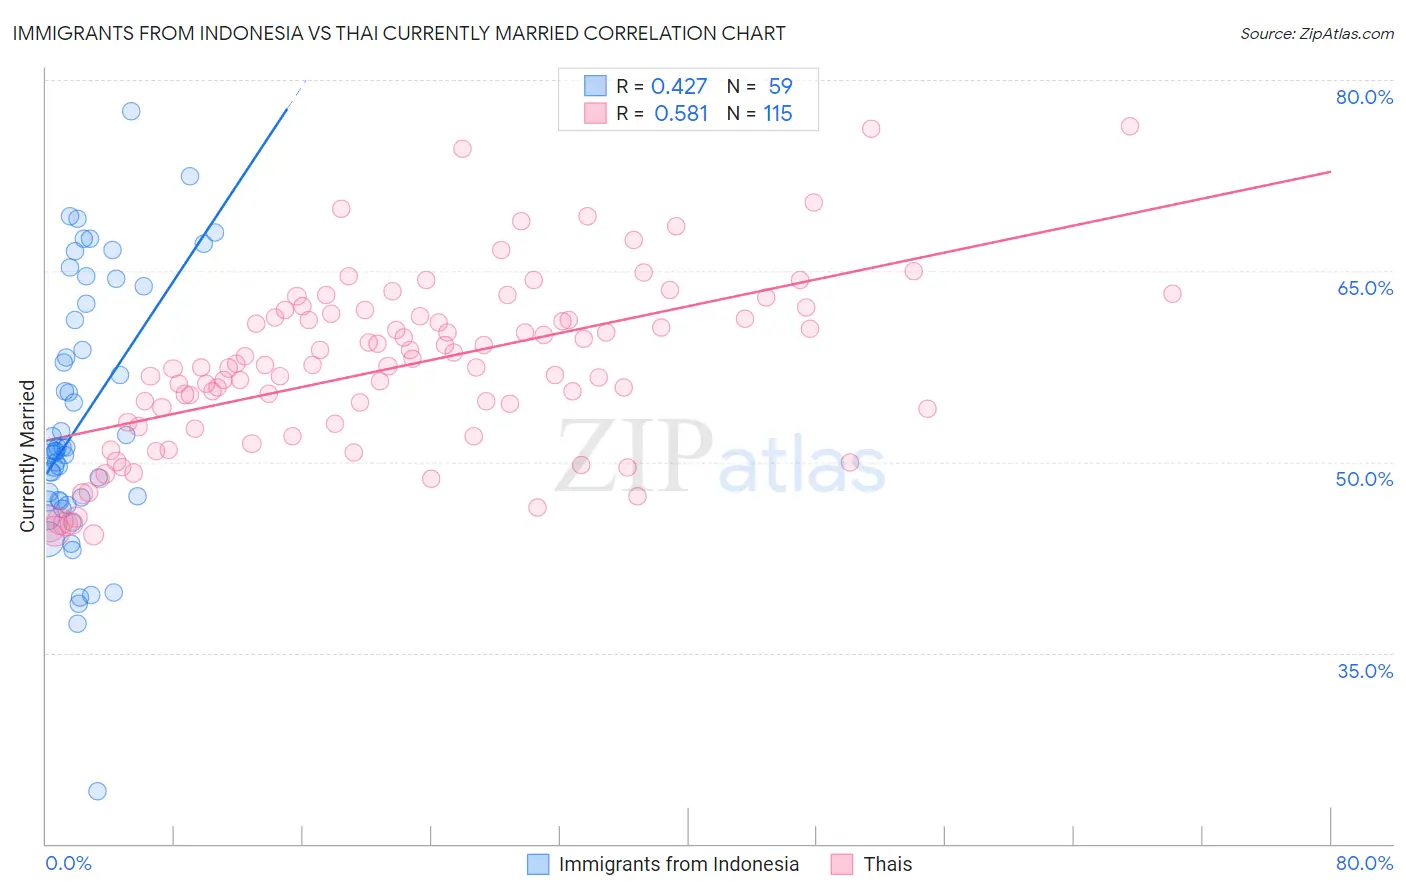
Immigrants from Indonesia vs Thai Currently Married Correlation Chart
The statistical analysis conducted on geographies consisting of 215,768,024 people shows a moderate positive correlation between the proportion of Immigrants from Indonesia and percentage of population currently married in the United States with a correlation coefficient (R) of 0.427 and weighted average of 47.6%. Similarly, the statistical analysis conducted on geographies consisting of 475,756,416 people shows a substantial positive correlation between the proportion of Thais and percentage of population currently married in the United States with a correlation coefficient (R) of 0.581 and weighted average of 50.9%, a difference of 6.9%.
Currently Married Correlation Summary
| Measurement | Immigrants from Indonesia | Thai |
| Minimum | 24.1% | 44.3% |
| Maximum | 77.5% | 76.4% |
| Range | 53.4% | 32.1% |
| Mean | 53.3% | 57.5% |
| Median | 51.0% | 57.5% |
| Interquartile 25% (IQ1) | 46.9% | 52.8% |
| Interquartile 75% (IQ3) | 62.4% | 61.5% |
| Interquartile Range (IQR) | 15.5% | 8.7% |
| Standard Deviation (Sample) | 10.3% | 6.8% |
| Standard Deviation (Population) | 10.2% | 6.8% |
Similar Demographics by Currently Married
Demographics Similar to Immigrants from Indonesia by Currently Married
In terms of currently married, the demographic groups most similar to Immigrants from Indonesia are South African (47.6%, a difference of 0.0%), Palestinian (47.6%, a difference of 0.010%), Puget Sound Salish (47.6%, a difference of 0.020%), Immigrants from Philippines (47.6%, a difference of 0.030%), and Australian (47.6%, a difference of 0.030%).
| Demographics | Rating | Rank | Currently Married |
| Tsimshian | 92.4 /100 | #108 | Exceptional 47.7% |
| Immigrants | Egypt | 92.3 /100 | #109 | Exceptional 47.7% |
| Immigrants | Russia | 92.0 /100 | #110 | Exceptional 47.7% |
| Immigrants | Hungary | 91.2 /100 | #111 | Exceptional 47.6% |
| Immigrants | Western Europe | 91.1 /100 | #112 | Exceptional 47.6% |
| Immigrants | Denmark | 90.9 /100 | #113 | Exceptional 47.6% |
| South Africans | 90.5 /100 | #114 | Exceptional 47.6% |
| Immigrants | Indonesia | 90.5 /100 | #115 | Exceptional 47.6% |
| Palestinians | 90.4 /100 | #116 | Exceptional 47.6% |
| Puget Sound Salish | 90.3 /100 | #117 | Exceptional 47.6% |
| Immigrants | Philippines | 90.2 /100 | #118 | Exceptional 47.6% |
| Australians | 90.2 /100 | #119 | Exceptional 47.6% |
| Syrians | 88.9 /100 | #120 | Excellent 47.5% |
| Immigrants | Croatia | 88.6 /100 | #121 | Excellent 47.5% |
| Osage | 87.9 /100 | #122 | Excellent 47.5% |
Demographics Similar to Thais by Currently Married
In terms of currently married, the demographic groups most similar to Thais are Assyrian/Chaldean/Syriac (50.8%, a difference of 0.18%), Immigrants from Taiwan (50.7%, a difference of 0.26%), Danish (50.5%, a difference of 0.81%), Norwegian (50.2%, a difference of 1.4%), and Immigrants from South Central Asia (50.0%, a difference of 1.7%).
| Demographics | Rating | Rank | Currently Married |
| Immigrants | India | 100.0 /100 | #1 | Exceptional 51.8% |
| Thais | 100.0 /100 | #2 | Exceptional 50.9% |
| Assyrians/Chaldeans/Syriacs | 100.0 /100 | #3 | Exceptional 50.8% |
| Immigrants | Taiwan | 100.0 /100 | #4 | Exceptional 50.7% |
| Danes | 100.0 /100 | #5 | Exceptional 50.5% |
| Norwegians | 100.0 /100 | #6 | Exceptional 50.2% |
| Immigrants | South Central Asia | 100.0 /100 | #7 | Exceptional 50.0% |
| Swedes | 100.0 /100 | #8 | Exceptional 50.0% |
| Czechs | 99.9 /100 | #9 | Exceptional 49.9% |
| Filipinos | 99.9 /100 | #10 | Exceptional 49.7% |
| English | 99.9 /100 | #11 | Exceptional 49.7% |
| Swiss | 99.9 /100 | #12 | Exceptional 49.7% |
| Dutch | 99.9 /100 | #13 | Exceptional 49.6% |
| Germans | 99.9 /100 | #14 | Exceptional 49.6% |
| Pennsylvania Germans | 99.9 /100 | #15 | Exceptional 49.6% |