Immigrants from Hong Kong vs Palestinian Married-couple Households
COMPARE
Immigrants from Hong Kong
Palestinian
Married-couple Households
Married-couple Households Comparison
Immigrants from Hong Kong
Palestinians
49.6%
MARRIED-COUPLE HOUSEHOLDS
99.9/ 100
METRIC RATING
17th/ 347
METRIC RANK
48.0%
MARRIED-COUPLE HOUSEHOLDS
96.9/ 100
METRIC RATING
92nd/ 347
METRIC RANK
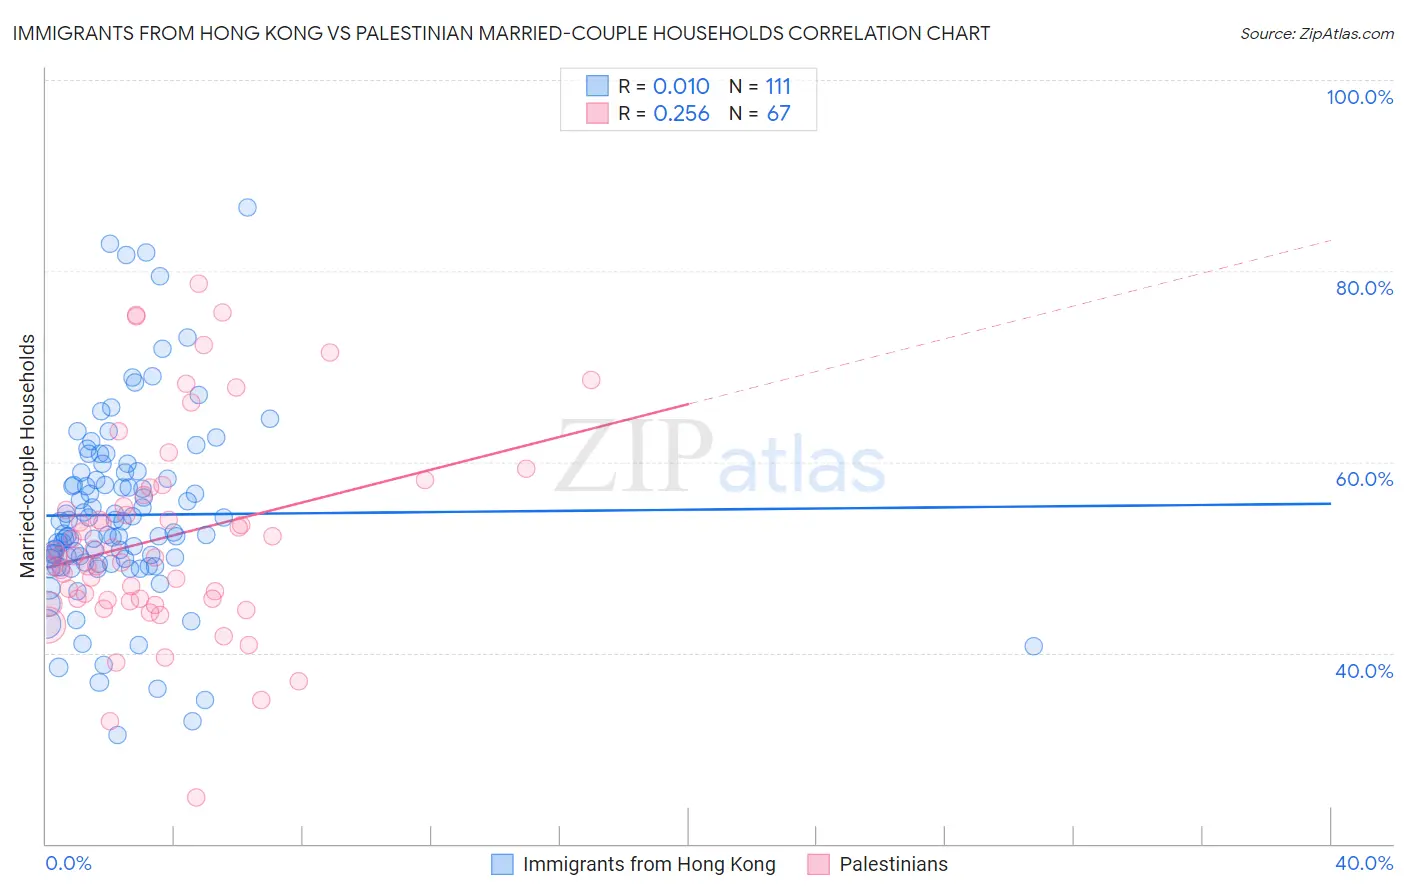
Immigrants from Hong Kong vs Palestinian Married-couple Households Correlation Chart
The statistical analysis conducted on geographies consisting of 253,895,593 people shows no correlation between the proportion of Immigrants from Hong Kong and percentage of married-couple family households in the United States with a correlation coefficient (R) of 0.010 and weighted average of 49.6%. Similarly, the statistical analysis conducted on geographies consisting of 216,389,787 people shows a weak positive correlation between the proportion of Palestinians and percentage of married-couple family households in the United States with a correlation coefficient (R) of 0.256 and weighted average of 48.0%, a difference of 3.5%.
Married-couple Households Correlation Summary
| Measurement | Immigrants from Hong Kong | Palestinian |
| Minimum | 31.4% | 24.9% |
| Maximum | 86.6% | 78.7% |
| Range | 55.2% | 53.9% |
| Mean | 54.4% | 52.0% |
| Median | 52.5% | 50.1% |
| Interquartile 25% (IQ1) | 49.3% | 45.5% |
| Interquartile 75% (IQ3) | 58.8% | 56.6% |
| Interquartile Range (IQR) | 9.5% | 11.1% |
| Standard Deviation (Sample) | 9.9% | 10.7% |
| Standard Deviation (Population) | 9.9% | 10.6% |
Similar Demographics by Married-couple Households
Demographics Similar to Immigrants from Hong Kong by Married-couple Households
In terms of married-couple households, the demographic groups most similar to Immigrants from Hong Kong are English (49.6%, a difference of 0.010%), Swedish (49.7%, a difference of 0.15%), European (49.6%, a difference of 0.17%), Scandinavian (49.6%, a difference of 0.17%), and Korean (49.7%, a difference of 0.18%).
| Demographics | Rating | Rank | Married-couple Households |
| Chinese | 100.0 /100 | #10 | Exceptional 50.4% |
| Immigrants | Pakistan | 100.0 /100 | #11 | Exceptional 50.1% |
| Swiss | 100.0 /100 | #12 | Exceptional 49.9% |
| Immigrants | Korea | 100.0 /100 | #13 | Exceptional 49.9% |
| Burmese | 100.0 /100 | #14 | Exceptional 49.8% |
| Koreans | 99.9 /100 | #15 | Exceptional 49.7% |
| Swedes | 99.9 /100 | #16 | Exceptional 49.7% |
| Immigrants | Hong Kong | 99.9 /100 | #17 | Exceptional 49.6% |
| English | 99.9 /100 | #18 | Exceptional 49.6% |
| Europeans | 99.9 /100 | #19 | Exceptional 49.6% |
| Scandinavians | 99.9 /100 | #20 | Exceptional 49.6% |
| Norwegians | 99.9 /100 | #21 | Exceptional 49.5% |
| Asians | 99.9 /100 | #22 | Exceptional 49.5% |
| Dutch | 99.9 /100 | #23 | Exceptional 49.5% |
| Czechs | 99.9 /100 | #24 | Exceptional 49.4% |
Demographics Similar to Palestinians by Married-couple Households
In terms of married-couple households, the demographic groups most similar to Palestinians are Immigrants from Moldova (48.0%, a difference of 0.020%), Lebanese (47.9%, a difference of 0.020%), American (47.9%, a difference of 0.020%), Immigrants from Belgium (47.9%, a difference of 0.060%), and French (48.0%, a difference of 0.080%).
| Demographics | Rating | Rank | Married-couple Households |
| Immigrants | Israel | 97.4 /100 | #85 | Exceptional 48.0% |
| Belgians | 97.4 /100 | #86 | Exceptional 48.0% |
| Immigrants | Ireland | 97.3 /100 | #87 | Exceptional 48.0% |
| Afghans | 97.3 /100 | #88 | Exceptional 48.0% |
| Cypriots | 97.2 /100 | #89 | Exceptional 48.0% |
| French | 97.2 /100 | #90 | Exceptional 48.0% |
| Immigrants | Moldova | 97.0 /100 | #91 | Exceptional 48.0% |
| Palestinians | 96.9 /100 | #92 | Exceptional 48.0% |
| Lebanese | 96.9 /100 | #93 | Exceptional 47.9% |
| Americans | 96.9 /100 | #94 | Exceptional 47.9% |
| Immigrants | Belgium | 96.8 /100 | #95 | Exceptional 47.9% |
| Immigrants | Egypt | 96.6 /100 | #96 | Exceptional 47.9% |
| Latvians | 96.5 /100 | #97 | Exceptional 47.9% |
| Immigrants | North Macedonia | 96.4 /100 | #98 | Exceptional 47.9% |
| Immigrants | Austria | 96.4 /100 | #99 | Exceptional 47.9% |