Immigrants from Hong Kong vs Palestinian In Labor Force | Age 20-24
COMPARE
Immigrants from Hong Kong
Palestinian
In Labor Force | Age 20-24
In Labor Force | Age 20-24 Comparison
Immigrants from Hong Kong
Palestinians
71.6%
IN LABOR FORCE | AGE 20-24
0.0/ 100
METRIC RATING
318th/ 347
METRIC RANK
75.6%
IN LABOR FORCE | AGE 20-24
88.4/ 100
METRIC RATING
132nd/ 347
METRIC RANK
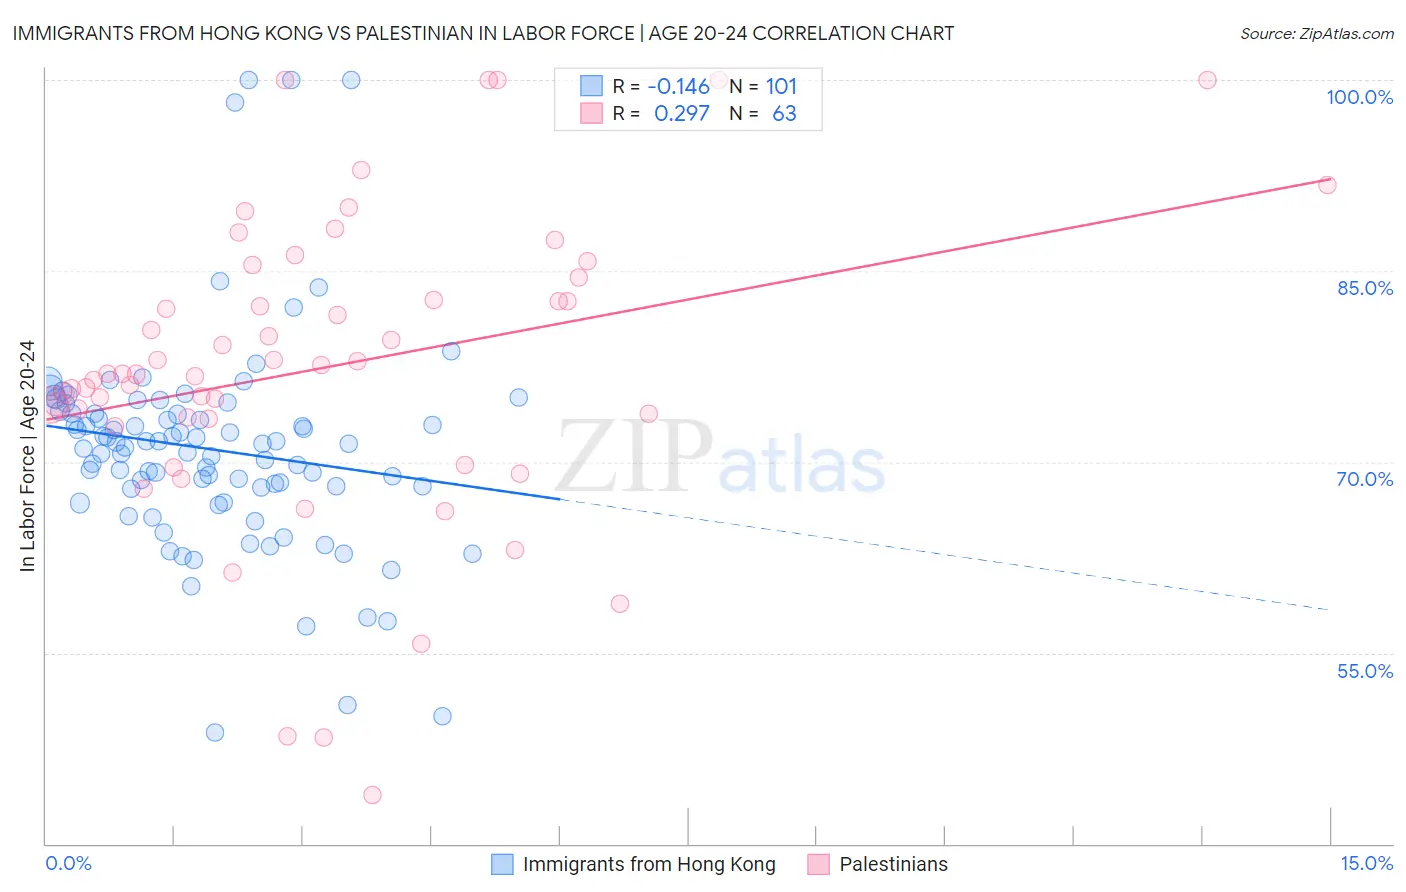
Immigrants from Hong Kong vs Palestinian In Labor Force | Age 20-24 Correlation Chart
The statistical analysis conducted on geographies consisting of 253,918,765 people shows a poor negative correlation between the proportion of Immigrants from Hong Kong and labor force participation rate among population between the ages 20 and 24 in the United States with a correlation coefficient (R) of -0.146 and weighted average of 71.6%. Similarly, the statistical analysis conducted on geographies consisting of 216,454,199 people shows a weak positive correlation between the proportion of Palestinians and labor force participation rate among population between the ages 20 and 24 in the United States with a correlation coefficient (R) of 0.297 and weighted average of 75.6%, a difference of 5.6%.
In Labor Force | Age 20-24 Correlation Summary
| Measurement | Immigrants from Hong Kong | Palestinian |
| Minimum | 48.7% | 43.8% |
| Maximum | 100.0% | 100.0% |
| Range | 51.3% | 56.2% |
| Mean | 71.0% | 77.5% |
| Median | 71.4% | 76.9% |
| Interquartile 25% (IQ1) | 67.9% | 73.4% |
| Interquartile 75% (IQ3) | 73.9% | 84.5% |
| Interquartile Range (IQR) | 5.9% | 11.1% |
| Standard Deviation (Sample) | 8.5% | 12.0% |
| Standard Deviation (Population) | 8.4% | 11.9% |
Similar Demographics by In Labor Force | Age 20-24
Demographics Similar to Immigrants from Hong Kong by In Labor Force | Age 20-24
In terms of in labor force | age 20-24, the demographic groups most similar to Immigrants from Hong Kong are Immigrants from Israel (71.6%, a difference of 0.030%), Immigrants from Armenia (71.7%, a difference of 0.090%), Trinidadian and Tobagonian (71.5%, a difference of 0.11%), Immigrants from Taiwan (71.5%, a difference of 0.16%), and Immigrants from Eastern Asia (71.8%, a difference of 0.26%).
| Demographics | Rating | Rank | In Labor Force | Age 20-24 |
| Apache | 0.0 /100 | #311 | Tragic 72.0% |
| Immigrants | Caribbean | 0.0 /100 | #312 | Tragic 71.9% |
| Immigrants | Dominica | 0.0 /100 | #313 | Tragic 71.9% |
| Indians (Asian) | 0.0 /100 | #314 | Tragic 71.9% |
| Immigrants | Iran | 0.0 /100 | #315 | Tragic 71.8% |
| Immigrants | Eastern Asia | 0.0 /100 | #316 | Tragic 71.8% |
| Immigrants | Armenia | 0.0 /100 | #317 | Tragic 71.7% |
| Immigrants | Hong Kong | 0.0 /100 | #318 | Tragic 71.6% |
| Immigrants | Israel | 0.0 /100 | #319 | Tragic 71.6% |
| Trinidadians and Tobagonians | 0.0 /100 | #320 | Tragic 71.5% |
| Immigrants | Taiwan | 0.0 /100 | #321 | Tragic 71.5% |
| Filipinos | 0.0 /100 | #322 | Tragic 71.4% |
| West Indians | 0.0 /100 | #323 | Tragic 71.3% |
| Immigrants | Dominican Republic | 0.0 /100 | #324 | Tragic 71.2% |
| Barbadians | 0.0 /100 | #325 | Tragic 71.1% |
Demographics Similar to Palestinians by In Labor Force | Age 20-24
In terms of in labor force | age 20-24, the demographic groups most similar to Palestinians are Immigrants from Jordan (75.6%, a difference of 0.0%), Immigrants from Austria (75.6%, a difference of 0.010%), Zimbabwean (75.6%, a difference of 0.010%), Iroquois (75.6%, a difference of 0.020%), and Immigrants from Afghanistan (75.6%, a difference of 0.040%).
| Demographics | Rating | Rank | In Labor Force | Age 20-24 |
| Immigrants | Scotland | 93.7 /100 | #125 | Exceptional 75.8% |
| Brazilians | 93.0 /100 | #126 | Exceptional 75.8% |
| Sub-Saharan Africans | 90.9 /100 | #127 | Exceptional 75.7% |
| Immigrants | Afghanistan | 89.4 /100 | #128 | Excellent 75.6% |
| Iroquois | 89.1 /100 | #129 | Excellent 75.6% |
| Immigrants | Austria | 88.8 /100 | #130 | Excellent 75.6% |
| Immigrants | Jordan | 88.5 /100 | #131 | Excellent 75.6% |
| Palestinians | 88.4 /100 | #132 | Excellent 75.6% |
| Zimbabweans | 88.2 /100 | #133 | Excellent 75.6% |
| Estonians | 87.1 /100 | #134 | Excellent 75.6% |
| Yaqui | 85.5 /100 | #135 | Excellent 75.5% |
| Immigrants | Brazil | 84.8 /100 | #136 | Excellent 75.5% |
| Jordanians | 84.8 /100 | #137 | Excellent 75.5% |
| Australians | 84.8 /100 | #138 | Excellent 75.5% |
| Immigrants | England | 84.6 /100 | #139 | Excellent 75.5% |